Graph Data Visualization With GraphQL & react-force-graph
William Lyon
September 29, 2021
10 min read
In this post we explore building an interactive graph data visualization using GraphQL as our data source, with the Lobsters GraphQL API we built previously. We'll be using Next.js, Vercel, and the react-force-graph library to add a graph visualization of users, tags, and articles posted to Lobste.rs. Previously we saw how to use GitHub Actions and Neo4j Aura to automate the import of Lobsters data into Neo4j, so check out the previous post if you're interested in that part.
Stay Updated
Get notified about new posts and videos
We're building this application on the Neo4j livestream so you can check out the video recording to accompany this blog post here:
Force Directed Layouts & Graph Visualization#
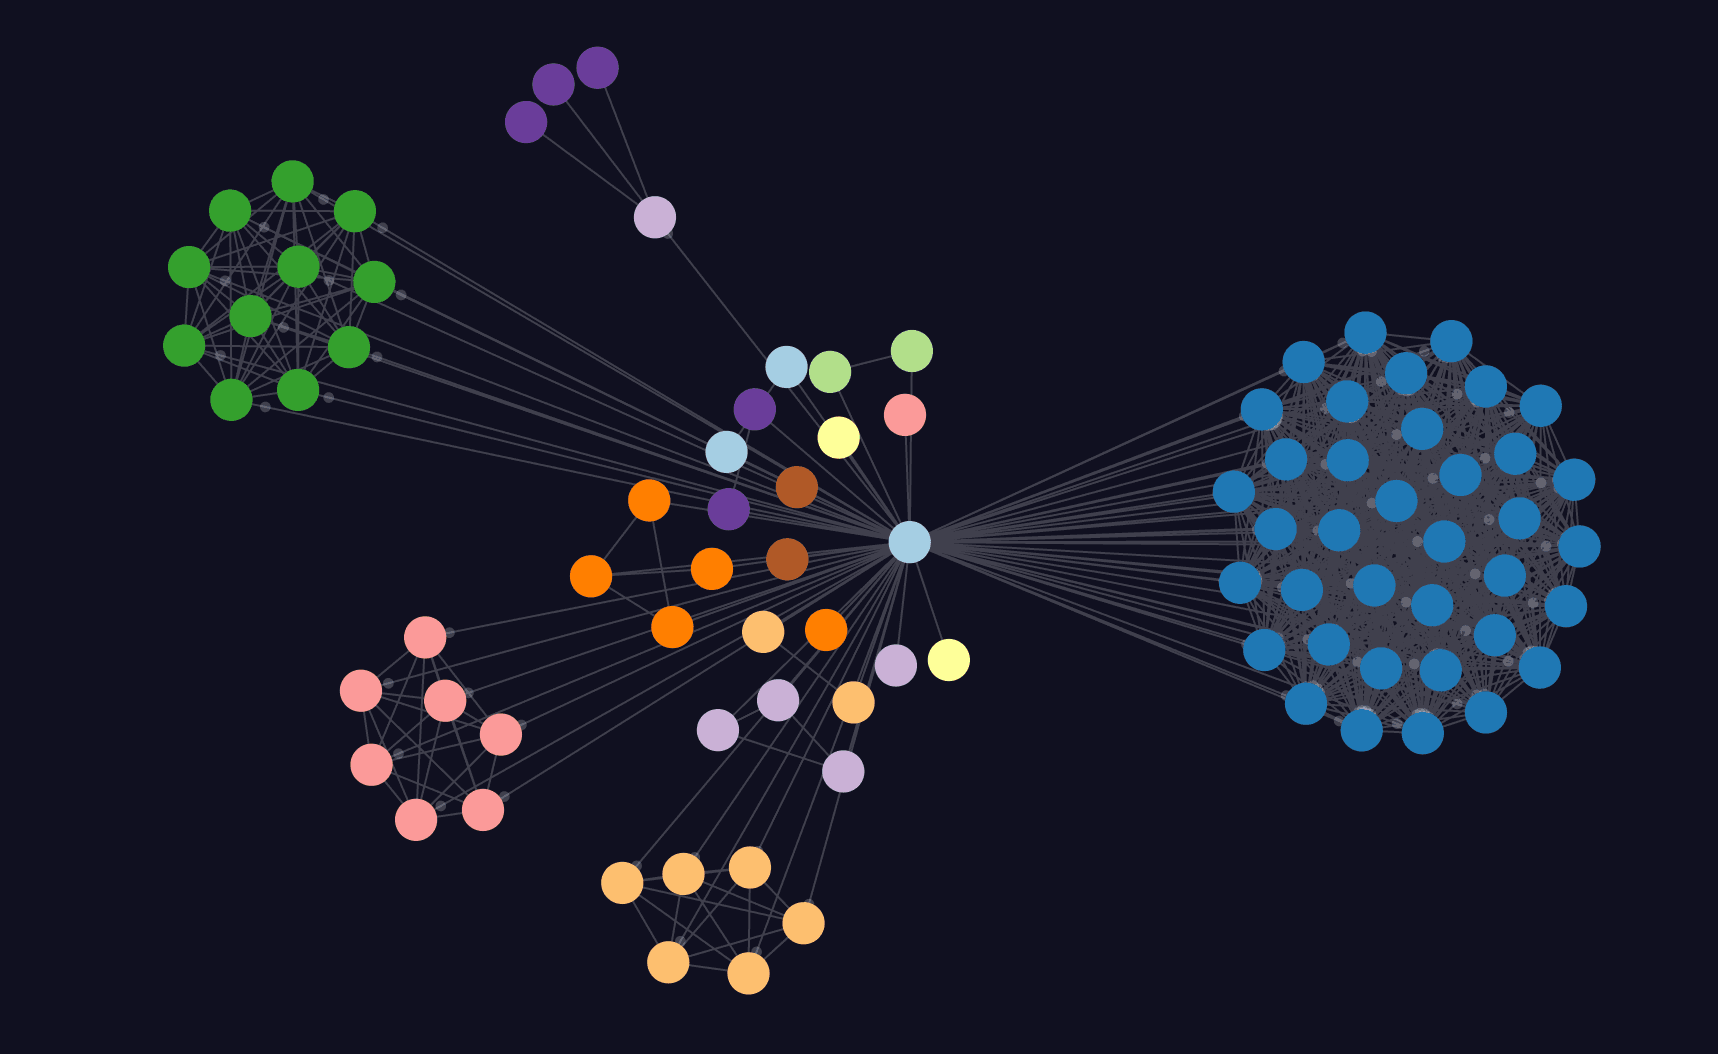
In the previous post we talked a bit about graph visualization with tools like Neo4j Bloom and Neo4j Browser, both of which are available in Neo4j Aura. Both Neo4j Bloom and Neo4j Browser (as well as many other tools and libraries) use a force-directed layout for graph visualization.
In a force-directed layout the nodes are positioned according to a physics simulation where connected nodes are attracted (think of the relationship acting as a spring) and nodes that are not connected to each other are pushed away from each other (like electrons). Force directed layouts are useful for graph visualization because they result in visual clusters of connected nodes that can help interpret the structure of the graph at a glance.
Graph Data Visualization With react-force-graph#
react-force-graphThe force-graph JavaScript library can be used to help build interactive data visualizations using a force-directed layout. It uses HTML5 Canvas for rendering and the d3-force layout algorithm. There are also 3D and AR/VR versions of the library, as well as a React flavor, which is what we'll be using.
Using react-force-graph with Next.js#
react-force-graph with Next.jsFirst, let's install the react-force-graph-2d package:
yarn add react-force-graph-2d
We're using Next.js to build our application which will by default use server side rendering (SSR) to render our pages, however we don't want our graph visualization to be rendered on the server because it depends on elements of client JavaScript that runs in the browser to render the visualization. So we'll use the dynamic import feature of Next.js and disable SSR.
We'll create a simple module that imports and exports the ForceGraph2D module:
import ForceGraph2D from 'react-force-graph-2d';
export default ForceGraph2D;
Then import that module using a dynamic import:
import dynamic from 'next/dynamic';

const NoSSRForceGraph = dynamic(() => import('../lib/NoSSRForceGraph'), {
  ssr: false
});
The force-graph component expects our graph data in a certain format. Specifically, we'll need to provide the node and relationship data in an object that contains two arrays, nodes and links. The nodes array will contain objects that represent the nodes in the visualization and must include at least an id value that identifies uniqueness of the node. The links array represents our relationships connecting nodes and reference their source and target nodes using the node id.
Let's hardcode some fake node and link data to get going with a very basic visualization:
const myData = {
  nodes: [{ id: 'a' }, { id: 'b' }, { id: 'c' }],
  links: [
    { source: 'a', target: 'b' },
    { source: 'c', target: 'a' }
  ]
};

export default function Home() {
  return <NoSSRForceGraph graphData={myData} />;
}
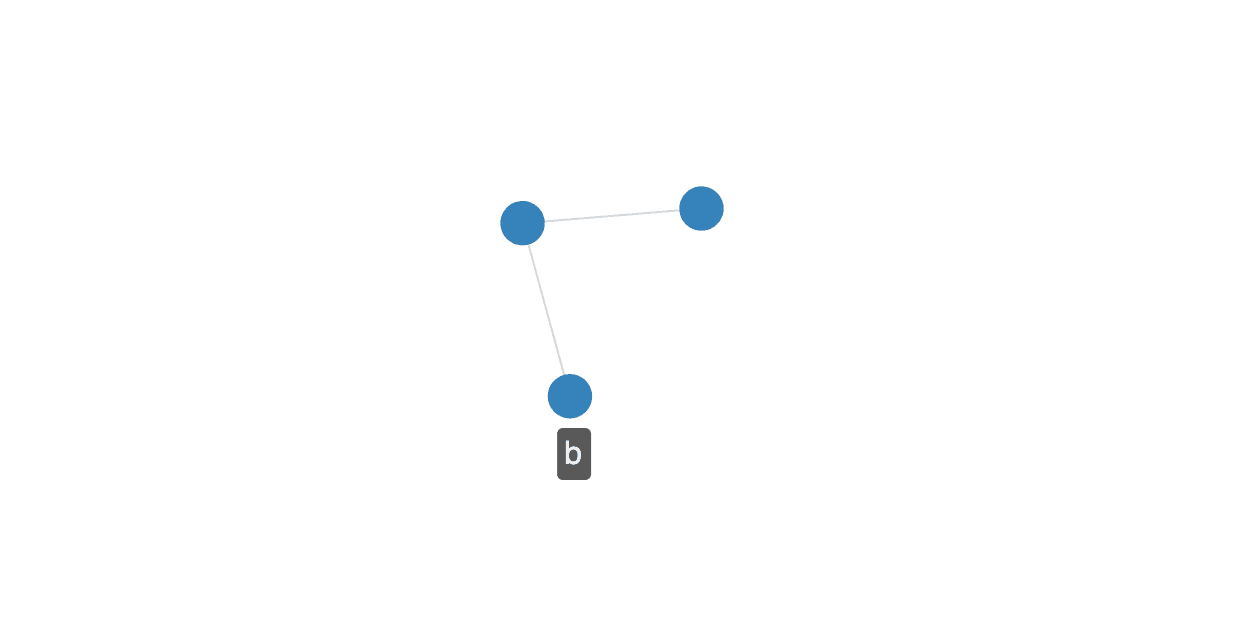
Here's our basic graph visualization using react-force-graph and Next.js so far:
Now it's time to bring in our data!
Setting Up Apollo Client In Next.js#
Since Next.js is a fullstack framework we'll be using GraphQL in two ways: 1) to implement our GraphQL server using the API Routes feature of Next.js, and 2) as a client of the GraphQL API to fetch and consume data via GraphQL.
We set up the GraphQL server in the previous episode so now it's time to set up the GraphQL client. We'll be using Apollo Client, which is one of the most popular GraphQL clients for React applications and will allow us to use some nice React Hooks for working with GraphQL data. First, let's install the @apollo/client package:
yarn add @apollo/client
Next, we need to create an Apollo Client instance and inject that client instance into the React component hierarchy using the ApolloProvider component so that the client instance will be available to all our React components. I covered setting up Apollo Client in a Next.js app in this blog post for the GRANDstack podcast application, so check that post out for a bit more detail, but we'll update pages/_app.js to create an Apollo Client instance:
import {
  ApolloProvider,
  ApolloClient,
  InMemoryCache,
  HttpLink
} from '@apollo/client';

const createApolloClient = () => {
  const link = new HttpLink({
    uri: '/api/graphql'
  });

  return new ApolloClient({
    link,
    cache: new InMemoryCache()
  });
};

function MyApp({ Component, pageProps }) {
  return (
    <ApolloProvider client={createApolloClient()}>
      <Component {...pageProps} />)
    </ApolloProvider>
  );
}

export default MyApp;
Pulling In GraphQL Data#
Now we can use the Apollo Client React hooks in our app. Let's replace the placeholder data in our graph visualization with data populated from a GraphQL query of the Lobsters graph GraphQL API. We'll need to write a GraphQL query that will return the most recent articles (let's get the most recent 30), as well as the tags of the article and the user who submitted it.
{
    articles(options: { limit: 30, sort: { created: DESC } }) {
      __typename
      id
      url
      title
      created
      tags {
        __typename
        name
      }
      user {
        username
        avatar
        __typename
      }
    }
  }
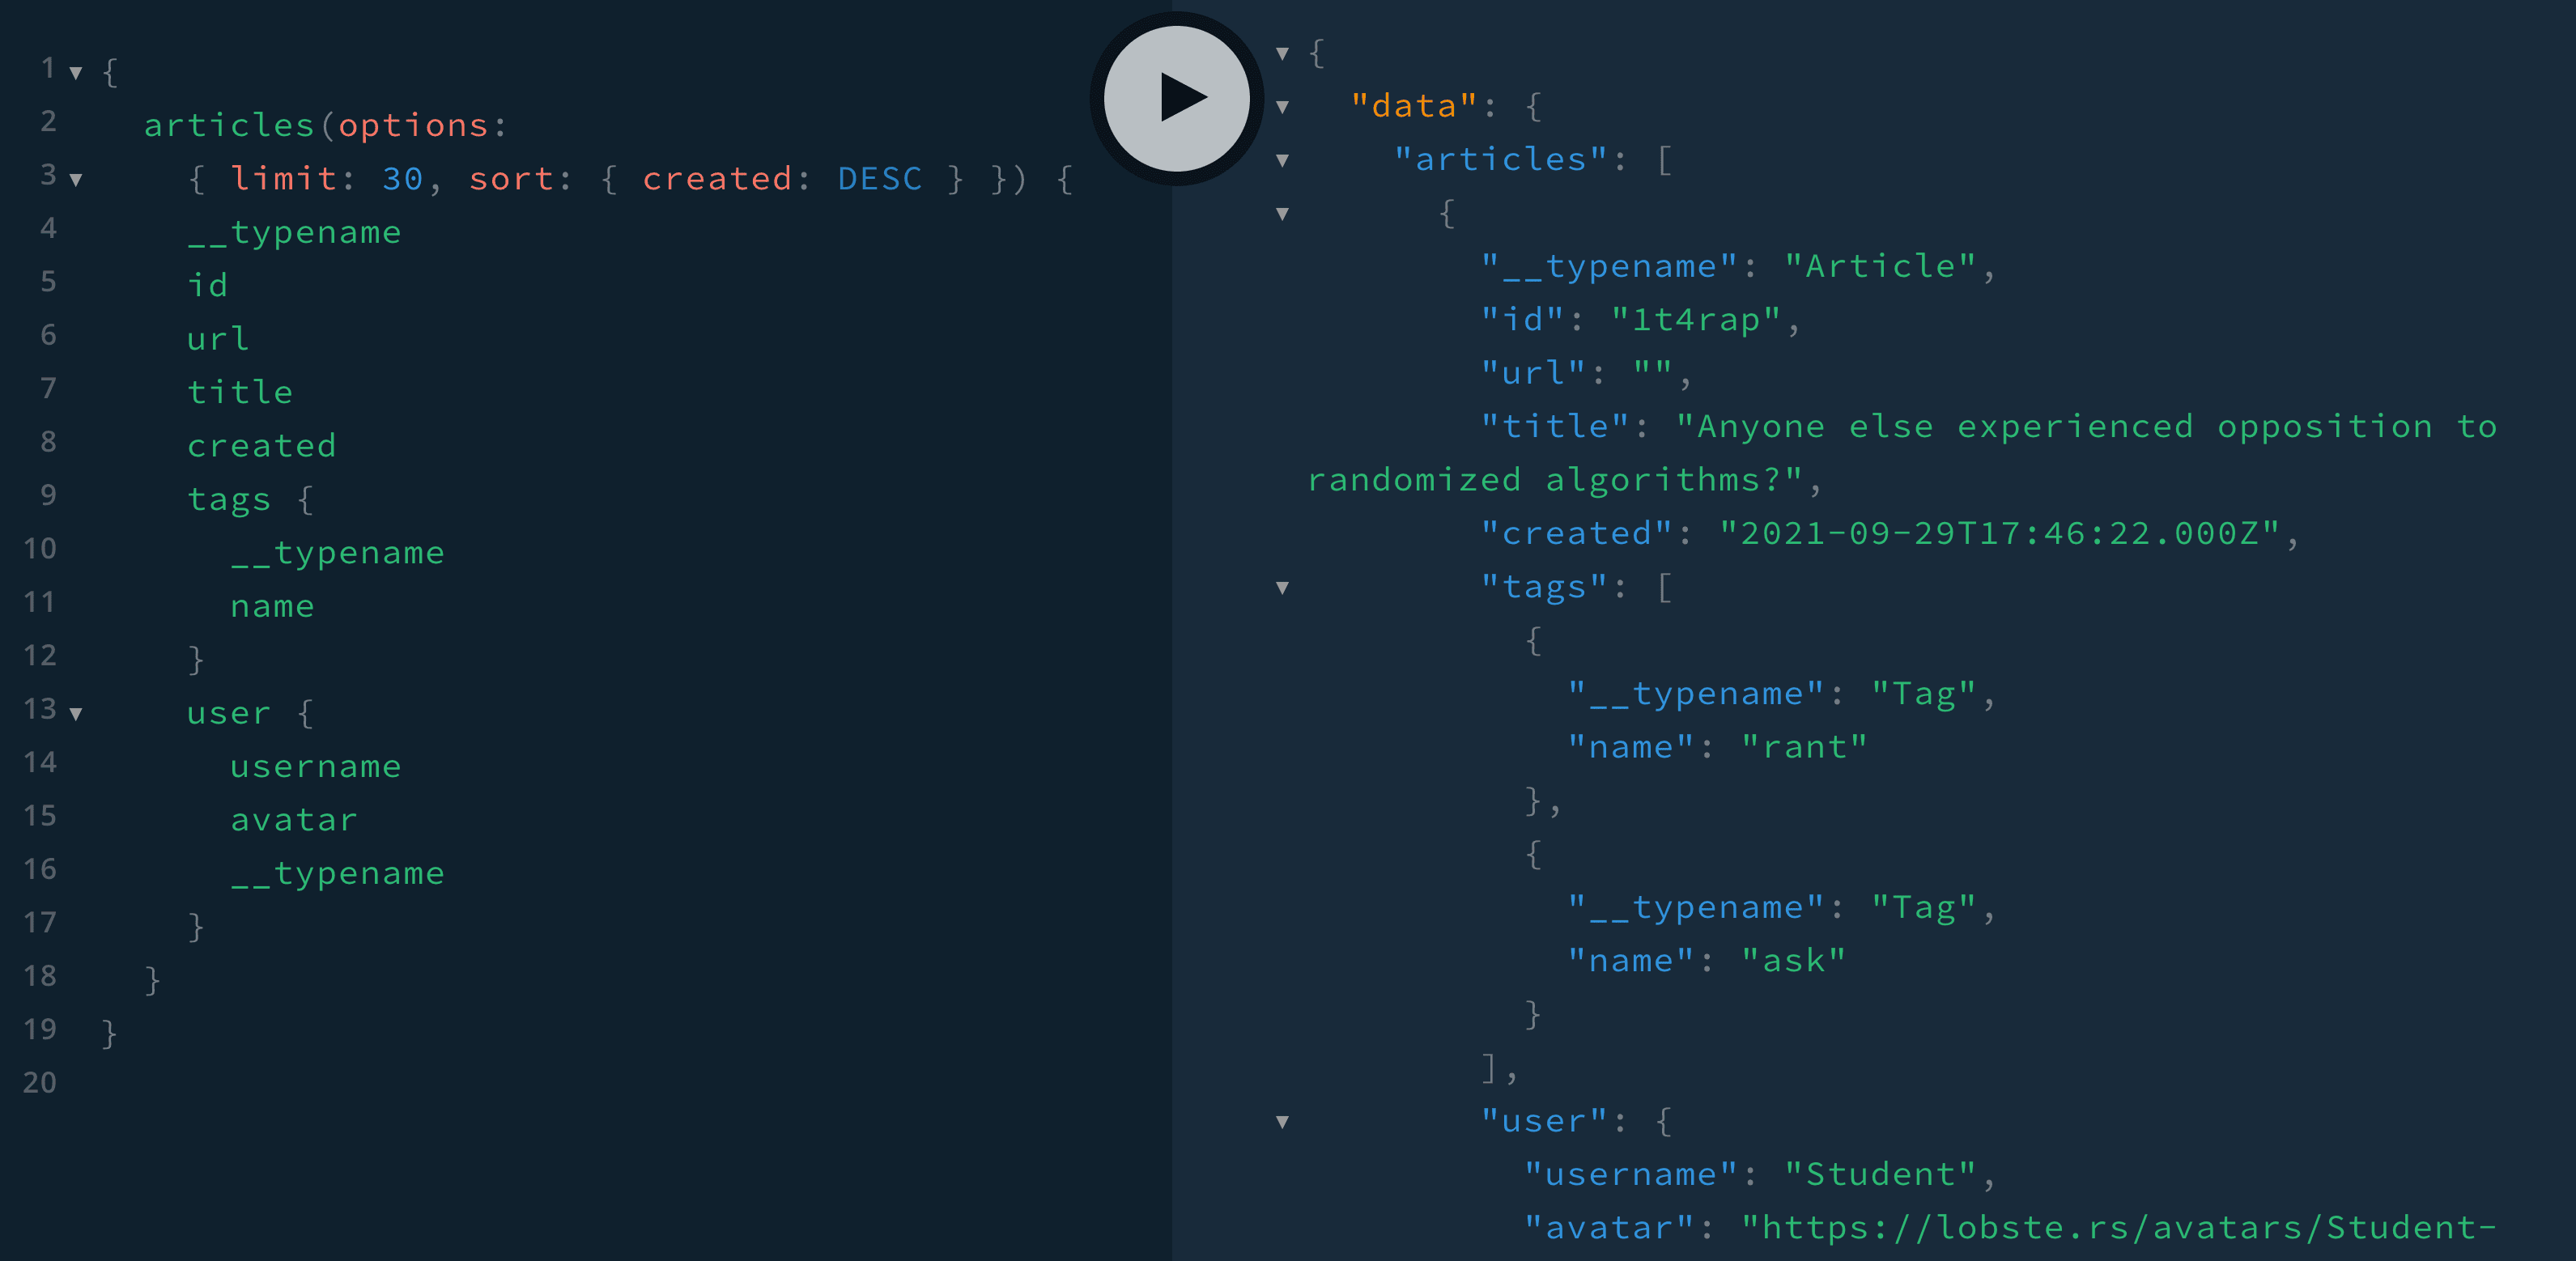
Let's update index.js to use this GraphQL query to fetch data from our GraphQL endpoint using the useQuery hook. We'll also need to write a function (formatData) to convert the JSON data returned from our GraphQL query to the nodes and links format expected by the force-graph component. Finally, we'll save the result of that transformation into a React state variable (graphData) and pass that to the force-graph component. That way as we update the graphData state variable our visualization will update.
import dynamic from 'next/dynamic';
import { useQuery, gql } from '@apollo/client';
import { useState } from 'react';

const NoSSRForceGraph = dynamic(() => import('../lib/NoSSRForceGraph'), {
  ssr: false
});

const mostRecentQuery = gql`
  {
    articles(options: { limit: 30, sort: { created: DESC } }) {
      __typename
      id
      url
      title
      created
      tags {
        __typename
        name
      }
      user {
        username
        avatar
        __typename
      }
    }
  }
`;

const formatData = (data) => {
  // this could be generalized but let's leave that for another time

  const nodes = [];
  const links = [];

  if (!data.articles) {
    return;
  }

  data.articles.forEach((a) => {
    nodes.push({
      id: a.id,
      url: a.url,
      __typename: a.__typename,
      title: a.title
    });

    links.push({
      source: a.user.username,
      target: a.id
    });

    a.tags.forEach((t) => {
      nodes.push({
        id: t.name,
        __typename: t.__typename
      });
      links.push({
        source: a.id,
        target: t.name
      });
    });

    nodes.push({
      id: a.user.username,
      avatar: a.user.avatar,
      __typename: a.user.__typename
    });
  });

  return {
    // nodes may be duplicated so use lodash's uniqBy to filter out duplicates
    nodes: _.uniqBy(nodes, 'id'),
    links
  };
};

export default function Home() {
  const [graphData, setGraphData] = useState({ nodes: [], links: [] });

  const { data } = useQuery(mostRecentQuery, {
    onCompleted: (data) => setGraphData(formatData(data))
  });

  return (
    <NoSSRForceGraph
      graphData={graphData}
      nodeLabel={(node) => {
        return node.id;
      }}
      nodeAutoColorBy={'__typename'}
      nodeRelSize={8}
    />
  );
}
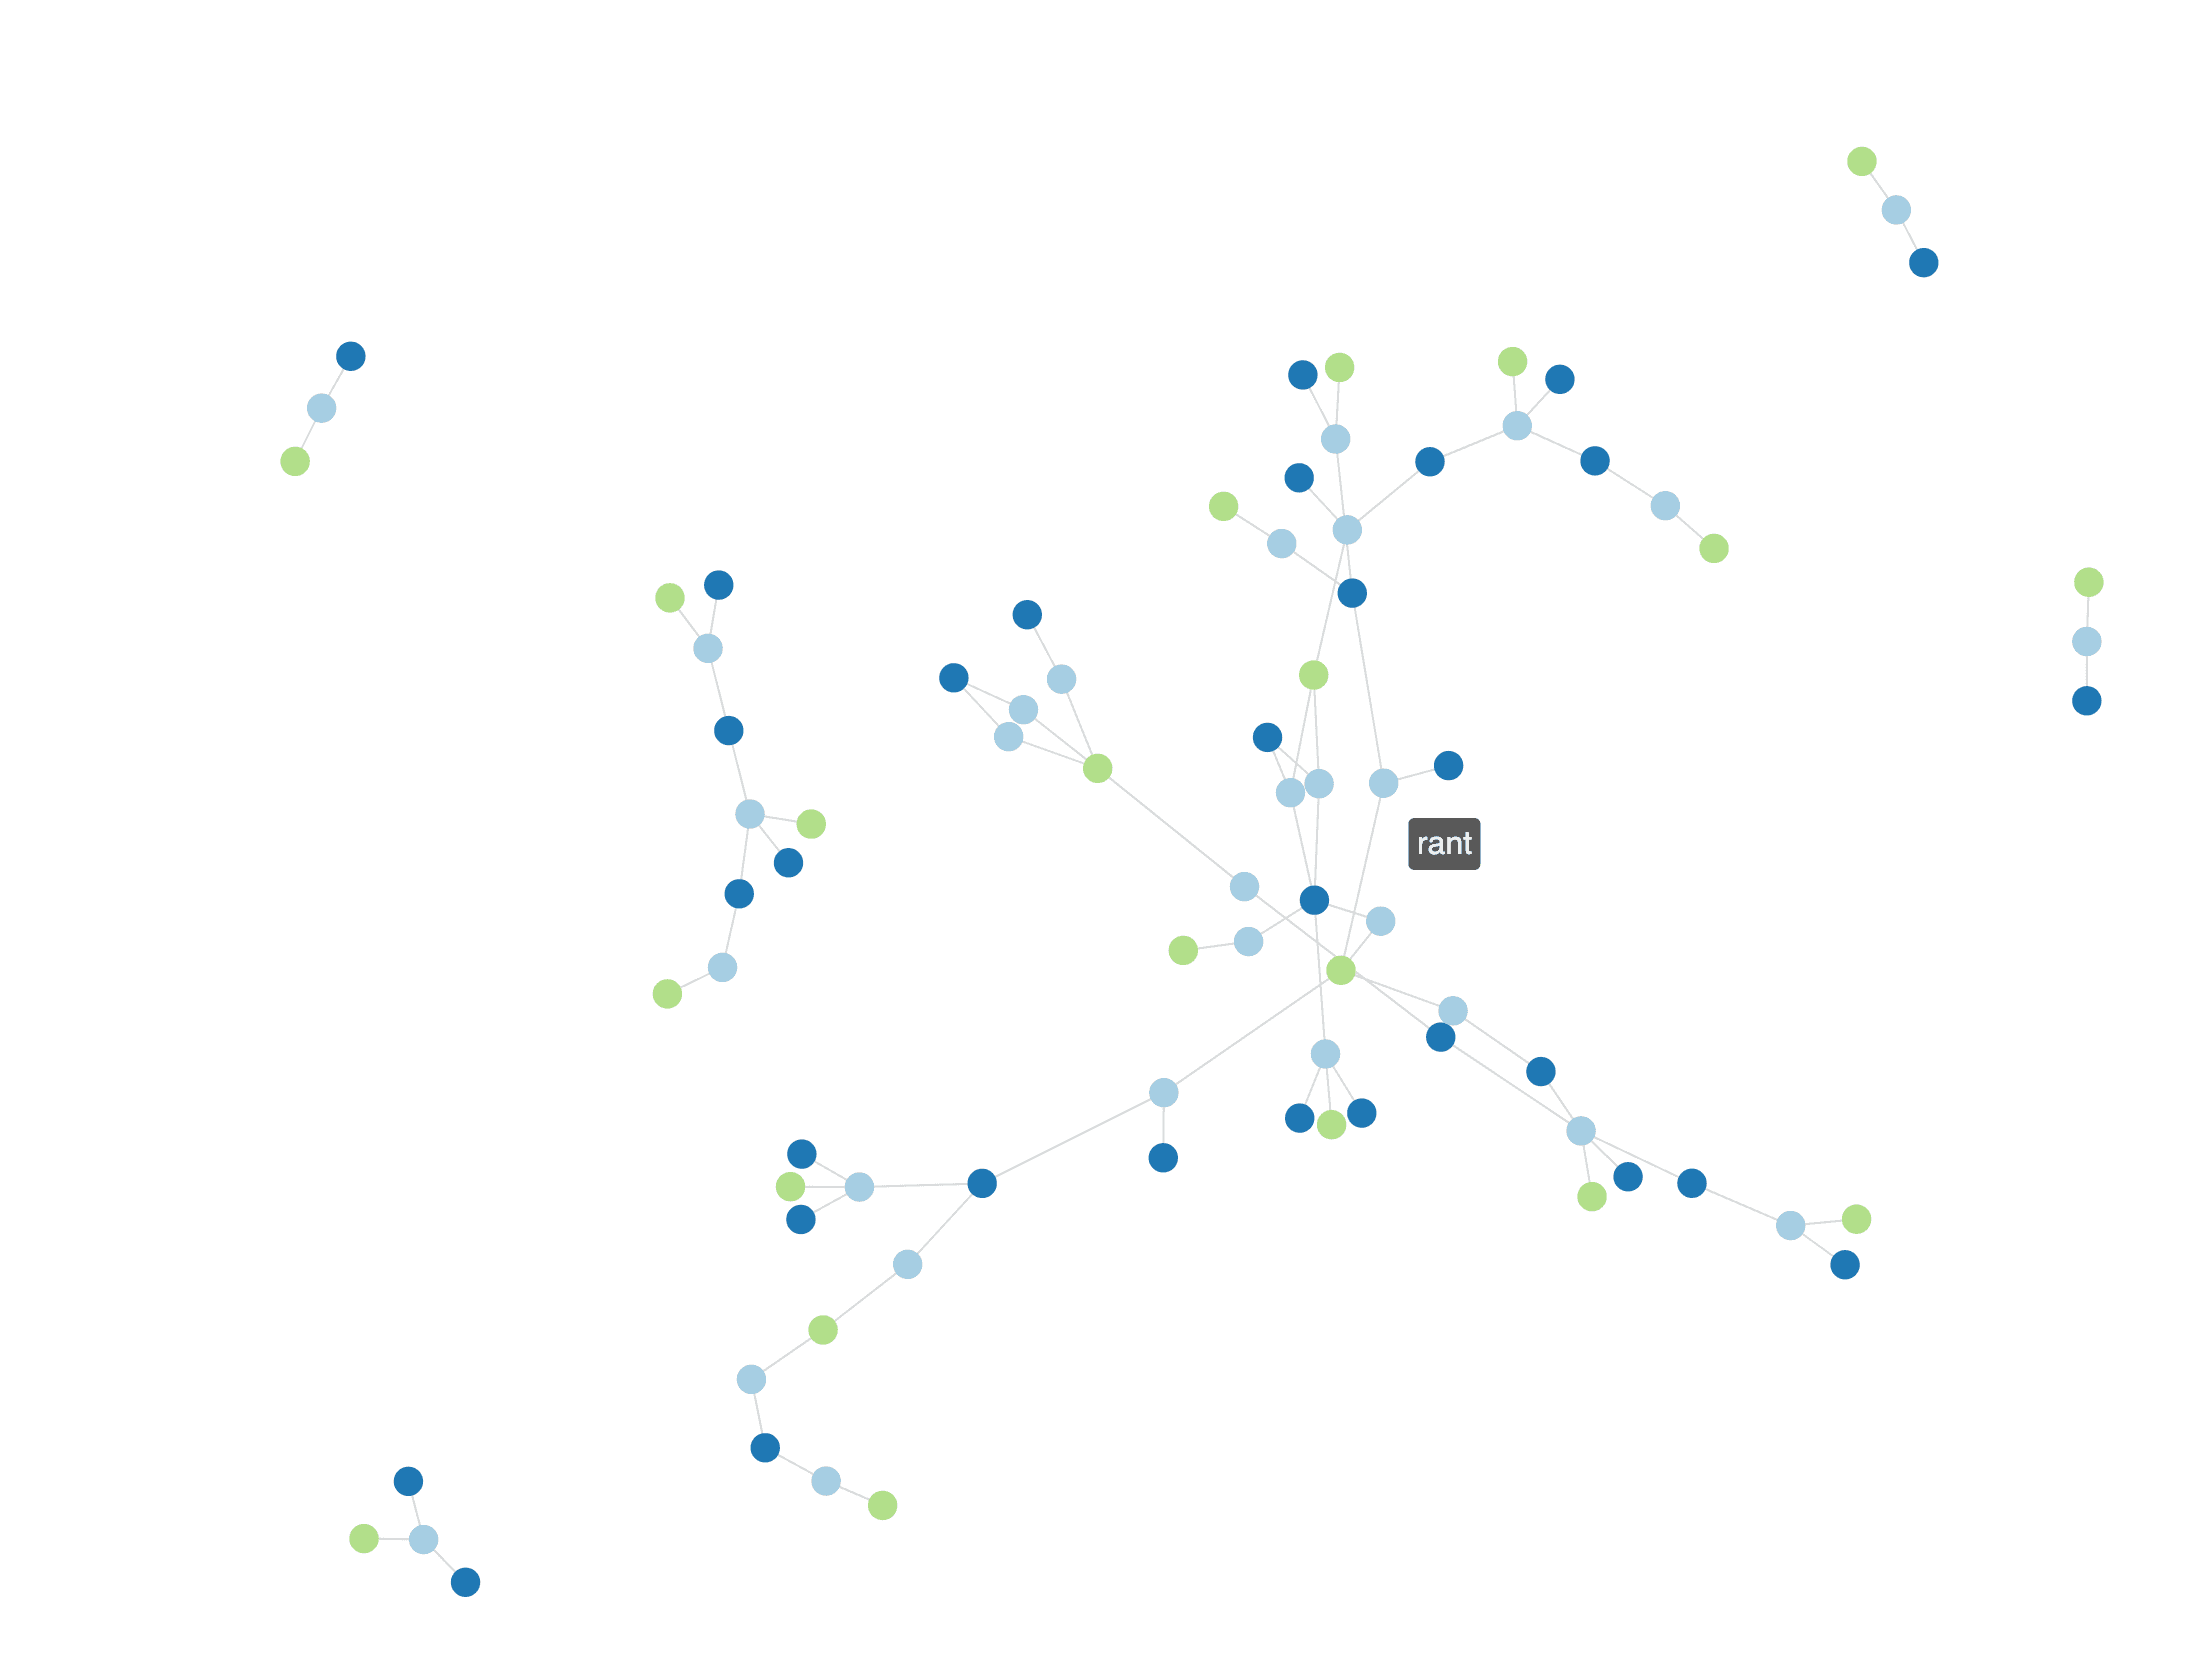
We also set the node label in the visualization to be the id value and use the nodeAutoColorBy configuration to assign colors by __typename (which map to node labels in the database). Here's what our visualization looks like now:
Adding More Nodes On Click#
We want our visualization to be interactive and enable users to explore the graph. Let's add more data to the visualization when a user clicks on one of the tag nodes, allowing the user to find more articles for tags they might be interested in. To do this we'll write another GraphQL query (moreArticlesQuery) that will find the 10 most recent articles for a given tag. Then, we'll use the useLazyQuery hook from Apollo Client to execute this query when a user clicks on a tag node in the onNodeClick handler for the force-graph component. We'll also open the article in a new tab if the user clicks on an article node.
import dynamic from 'next/dynamic';
import { useQuery, useLazyQuery, gql } from '@apollo/client';
import { useState } from 'react';

const NoSSRForceGraph = dynamic(() => import('../lib/NoSSRForceGraph'), {
  ssr: false
});

const moreArticlesQuery = gql`
  query articlesByTag($tag: String) {
    articles(
      where: { tags: { name: $tag } }
      options: { limit: 10, sort: { created: DESC } }
    ) {
      __typename
      id
      url
      title
      created
      tags {
        __typename
        name
      }
      user {
        username
        avatar
        __typename
      }
    }
  }
`;

export default function Home() {
  const [graphData, setGraphData] = useState({ nodes: [], links: [] });
  const { data } = useQuery(mostRecentQuery, {
    onCompleted: (data) => setGraphData(formatData(data))
  });
  const [loadMoreArticles, { called, loading, data: newData }] = useLazyQuery(
    moreArticlesQuery,
    {
      onCompleted: (data) => {
        const newSubgraph = formatData(data);
        setGraphData({
          nodes: _.uniqBy([...graphData.nodes, ...newSubgraph.nodes], 'id'),
          links: [...graphData.links, ...newSubgraph.links]
        });
      }
    }
  );

  return (
    <NoSSRForceGraph
      graphData={graphData}
      nodeLabel={(node) => {
        return node.id;
      }}
      nodeAutoColorBy={'__typename'}
      nodeRelSize={8}
      onNodeClick={(node, event) => {
        console.log('You clicked me!');
        console.log(node);

        if (node.__typename === 'Tag') {
          console.log('Lode more articles');
          loadMoreArticles({ variables: { tag: node.id } });
        } else if (node.__typename == 'Article') {
          window.open(node.url, '_blank');
        }
      }}
    />
  );
}
Now here's what our visualization looks like after expanding a few tags.
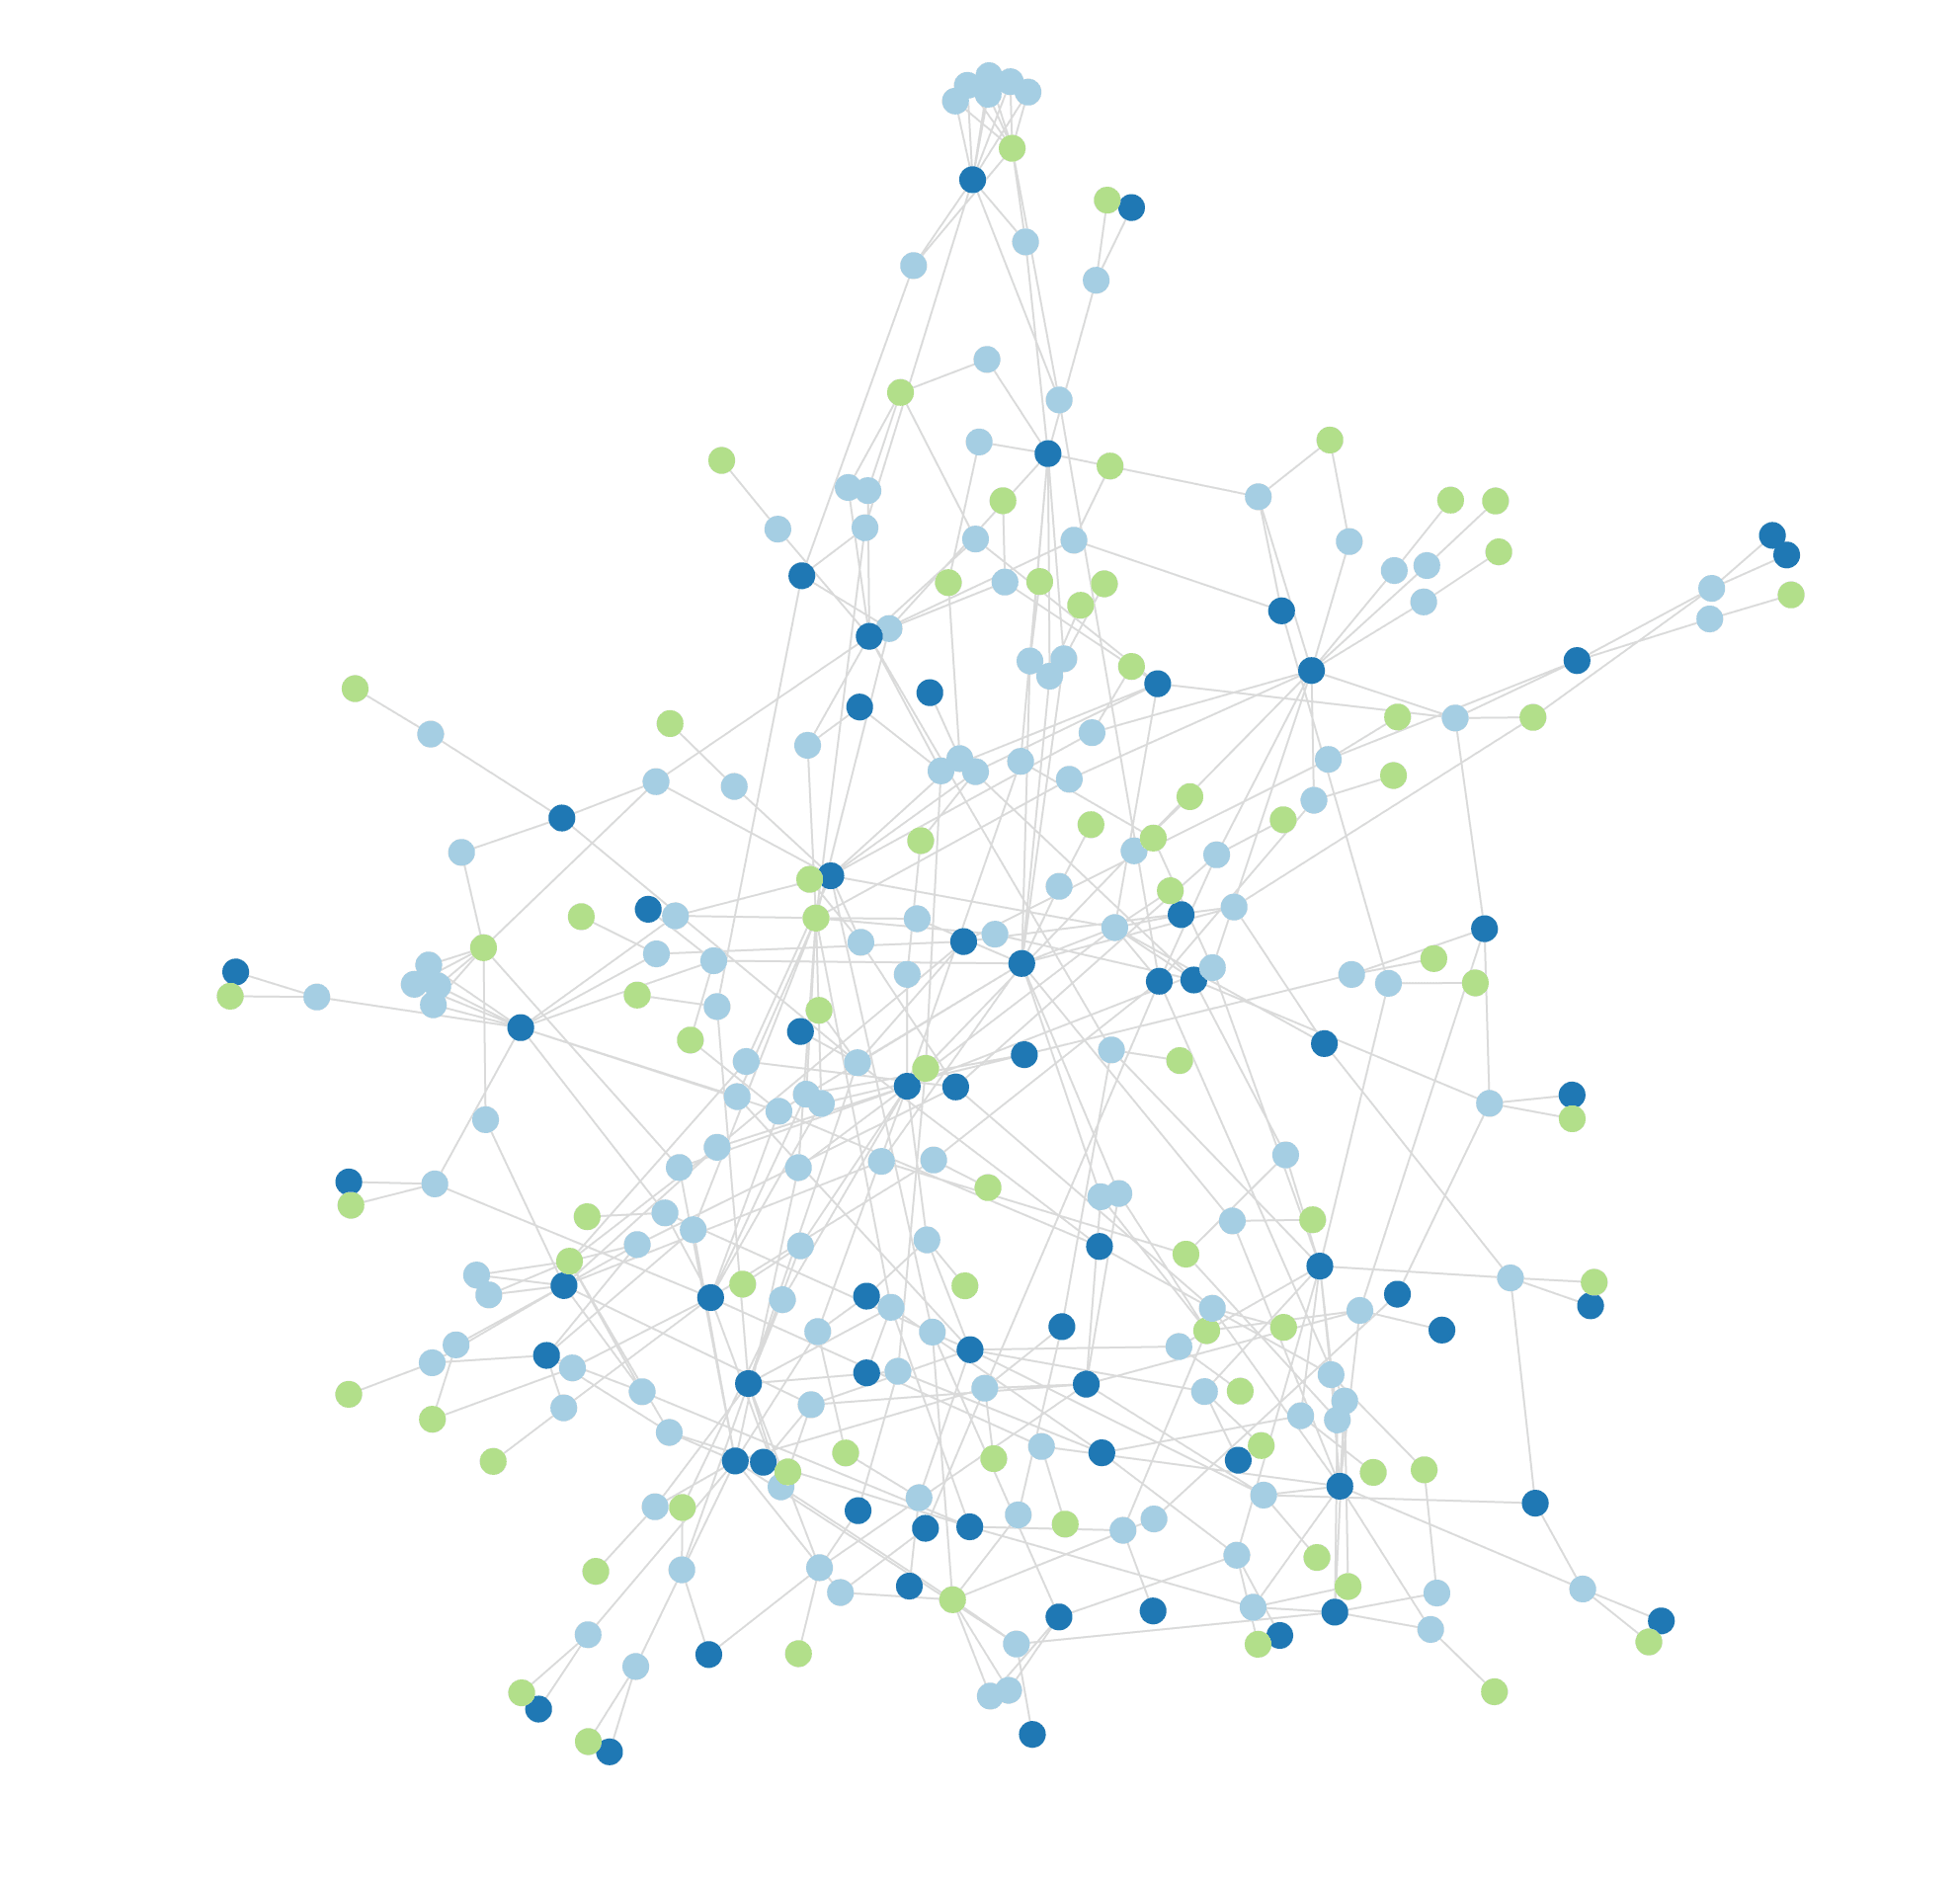
It's a bit difficult to see at a glance what the tags and article titles are. Let's use text to represent the nodes in our visualization so we can see the relevant information without hovering over the nodes to see their labels.
Representing Nodes With Text#
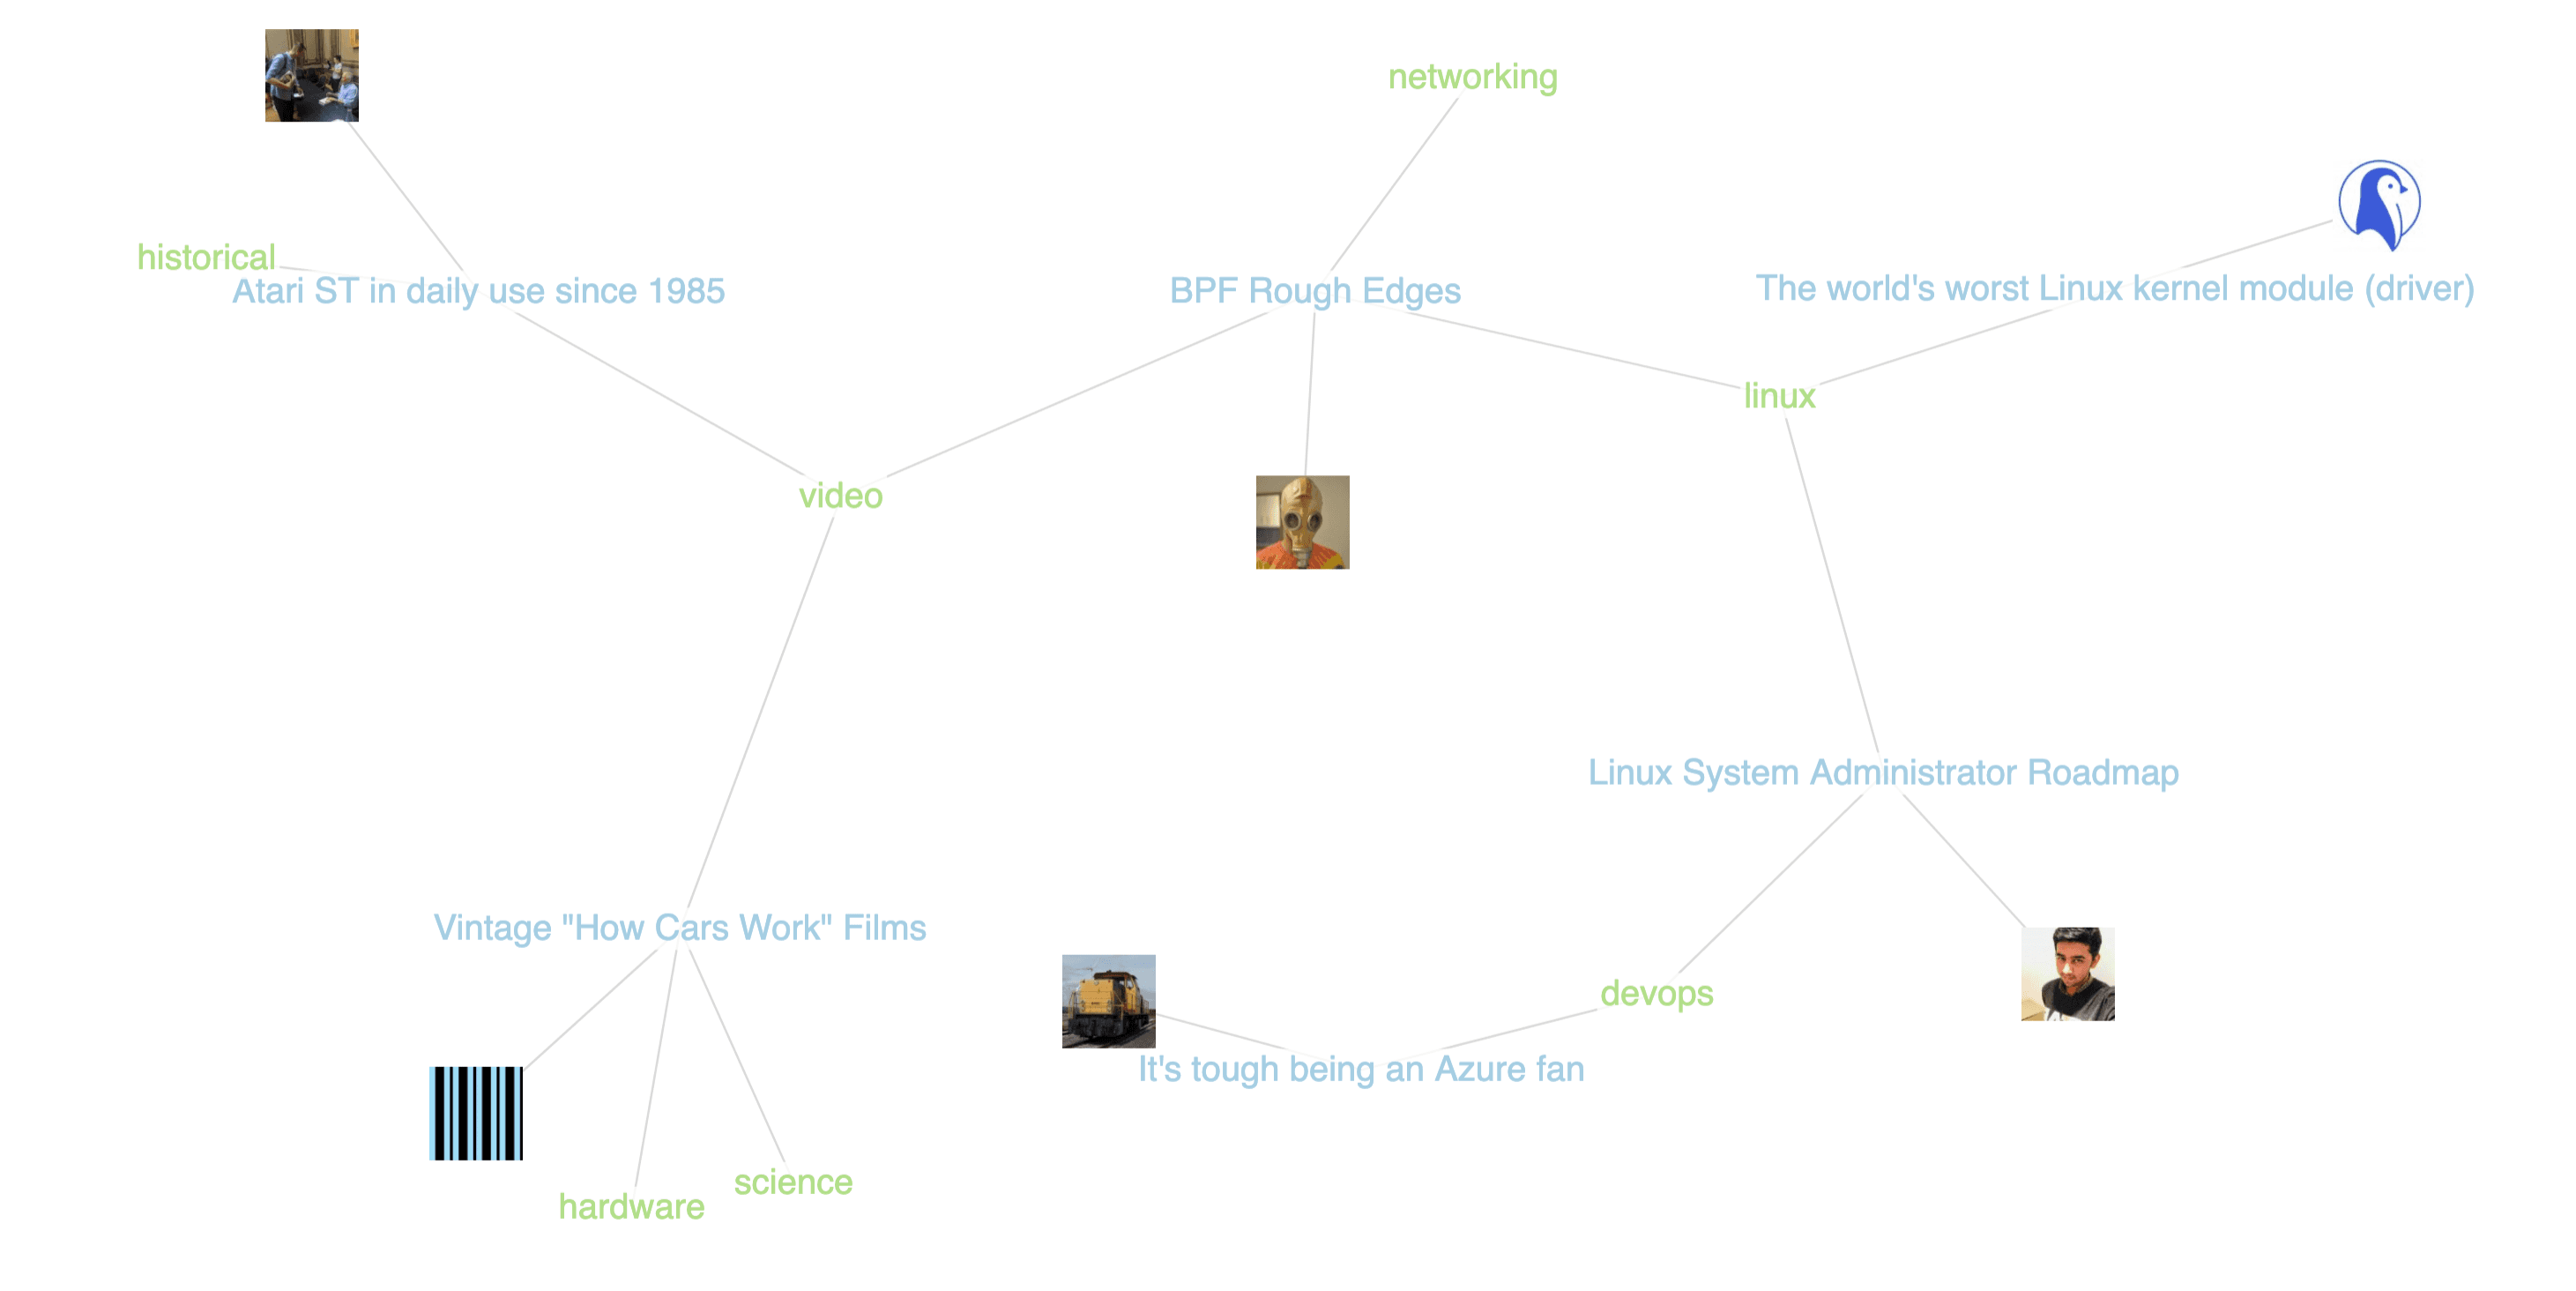
In order to change the visual representation of each node we'll need to override the nodeCanvasObject function. This function will allow us to the HTML Canvas API to style the nodes however we like. Using this example as a guide, let's use Canvas to style our nodes as text. We'll also use the user's avatar image to represent the user node.
return (
  <NoSSRForceGraph
    {/* other props omitted*/}
    nodeCanvasObject={(node, ctx, globalScale) => {
        if (node.__typename === "Tag" || node.__typename === "Article") {
          const label = node.title || node.id;
          const fontSize = 16 / globalScale;
          ctx.font = `${fontSize}px Sans-Serif`;
          const textWidth = ctx.measureText(label).width;
          const bckgDimensions = [textWidth, fontSize].map(
            (n) => n + fontSize * 0.2
          );
          ctx.fillStyle = `rgba(255, 255, 255, 0.8)`;
          ctx.fillRect(
            node.x - bckgDimensions[0] / 2,
            node.y - bckgDimensions[1] / 2,
            ...bckgDimensions
          );
          ctx.textAlign = "center";
          ctx.textBaseline = "middle";
          ctx.fillStyle = node.color;
          ctx.fillText(label, node.x, node.y);

          node.__bckgDimensions = bckgDimensions;
        } else if (node.__typename === "User") {
          const size = 12;
          const img = new Image();
          img.src = node.avatar;
          ctx.drawImage(img, node.x - size / 2, node.y - size / 2, size, size);
        }
    }}
  />
)
And now we can see at a glance the article titles and tags:
That's all for now, in the next post we'll take a look at improving some of the styling of our visualization and bring in some other visualization elements to help us explore the data and find articles we're interested in. You can find the current version of the app here and the GraphQL API is available here if you'd like to try some queries against it.
Resources#
- Code is available on GitHub
- Apollo Client
useLazyQueryhook - HTML Canvas API Tutorial
- Lodash
uniqByarray function - Dynamic import with Next.js
- Building A GraphQL API With Next.js API Routes
- Canvas drawImage
- The
force-graphpackage - The
react-force-graphpackage
For comments and discussion please join the conversation for this post at Dev.to
Stay Updated
Get notified about new posts and videos