Plus Writing Spatial SQL Queries With AWS Athena#
In this post we take a look at the recently released public map dataset from the Overture Maps Foundation. We'll see how to select a subset of the data using AWS Athena, how to import the map data into a Neo4j graph database using Neo4j Aura's no-code visual import and data modeling tooling, and finally we'll see how to leverage other no & low-code tooling to create a dashboard using the Neodash graph app and GraphQL API using the Neo4j GraphQL Toolbox.
Stay Updated
Get notified about new posts and videos
Overture Maps Foundation Releases Public Dataset#
The Overture Maps Foundation is a collaboration among Meta, Microsoft, TomTom, Amazon, and others with the goal of building a public dataset of map data. It's a Linux Foundation project, similar in structure to the GraphQL Foundation which is a group I'm more familiar with having previously served as Neo4j's representative to the GraphQL Foundation for a few years.
Overture's goal in their own words is:
Powering current and next-generation map products by creating reliable, easy-to-use, and interoperable open map data.

Overture released the first alpha version of their public dataset on July 26th, 2023 so I thought this would be a good time to take a look at the structure of the data in the public dataset as well as see how we can import and analyze the data using Neo4j.
The Overture data consists of four "themes": places, transport, admins, and buildings and is published as Parquet files available via AWS or Azure. Previously I've used Python's pandas library and the Neo4j Python Driver to parse Parquet files into Python dataframes and then import into Neo4j using Cypher (you can see an example of that approach here where I import the Daylight Earth Table OpenStreetMap distribution into Neo4j from Parquet files) but for this project I wanted to stay as code-free as possible and instead use AWS Athena's serverless SQL engine to parse and query the Overture Parquet files then use Neo4j's visual data import tool. This did require that I write a bit of SQL.
You can find more detailed information about each theme in the Overture Maps documentation here.
Querying Overture Maps Data With AWS Athena#
AWS Athena is a serverless SQL engine that will allow us to execute SQL queries on the Parquet files distributed by Overture.
First, in AWS Athena we need to create a table. I'll start with creating the places table, which maps to the Overture places Parquet theme. To create the table in Athena I'll need to specify the schema used for the places theme.
CREATE EXTERNAL TABLE `places`(
  `id` string,
  `updateTime` string,
  `version` int,
  `names` map<string,array<map<string,string>>>,
  `categories` struct<main:string,alternate:array<string>>,
  `confidence` double,
  `websites` array<string>,
  `socials` array<string>,
  `emails` array<string>,
  `phones` array<string>,
  `brand` struct<names:map<string,array<map<string,string>>>,wikidata:string>,
  `addresses` array<map<string,string>>,
  `sources` array<map<string,string>>,
  `bbox` struct<minX:double,maxX:double,minY:double,maxY:double>,
  `geometry` binary)
PARTITIONED BY (
  `type` varchar(5))
STORED AS PARQUET
LOCATION
  's3://overturemaps-us-west-2/release/2023-07-26-alpha.0/theme=places'
And then to trigger building the table.
MSCK REPAIR TABLE `places`
Now that we've created the places table, let's write a SQL query to fetch a subset of the Overture places data based on some bouding box. We'll download the results as a CSV file and then use the no-code Neo4j Import tool to create our graph in Neo4j Aura by mapping fields of the CSV file to the property graph model we wish to create using a visual diagramming interface. It's really quite slick!
Let's subset the data based on the bounds of Clark County, Nevada in the US (home of Las Vegas). We can do that using a bbox predicate that specifies the lower-left and upper-right coordinates of our bounding box. Some of the attributes in the places table are json data so we'll also parse those fields as json and extract the relevant scalar values such as the name, category, and address components using json_extract and json_array_get SQL functions.
For the places theme each row will contain a point geometry, stored efficiently in the binary WKB (Well Known Binary) format. We'll use the ST_GeomFromBinary spatial SQL function to convert that geometry field to WKT (Well Known Text) format and then the ST_X and ST_Y functions to retrieve the point's longitude and latitude.
SELECT
    id, updatetime, version, confidence, websites, socials, emails, phones, type,
    ST_X(ST_GeomFromBinary(geometry)) as longitude,
    ST_Y(ST_GeomFromBinary(geometry)) as latitude,
    json_extract_scalar(cast(categories as json), '$.main') as category,
    json_extract(cast(categories as json), '$.alternate') as alt_categories,
    json_extract_scalar(cast(names as json), '$.common[0].value') as name,
    json_extract(json_array_get(cast(sources as json), 0), '$.dataset') as source_dataset,
    json_extract(json_array_get(cast(sources as json), 0), '$.recordid') as source_recordid,
    json_extract(json_array_get(cast(addresses as json), 0), '$.freeform') as street_address,
    json_extract(json_array_get(cast(addresses as json), 0), '$.locality') as locality,
    json_extract(json_array_get(cast(addresses as json), 0), '$.postcode') as postcode,
    json_extract(json_array_get(cast(addresses as json), 0), '$.region') as region,
    json_extract(json_array_get(cast(addresses as json), 0), '$.country') as country
FROM
    places
WHERE
        bbox.minX >  -115.896925
    AND bbox.maxX <  -114.042819
    AND bbox.minY >  35.001857
    AND bbox.maxY <  36.853662
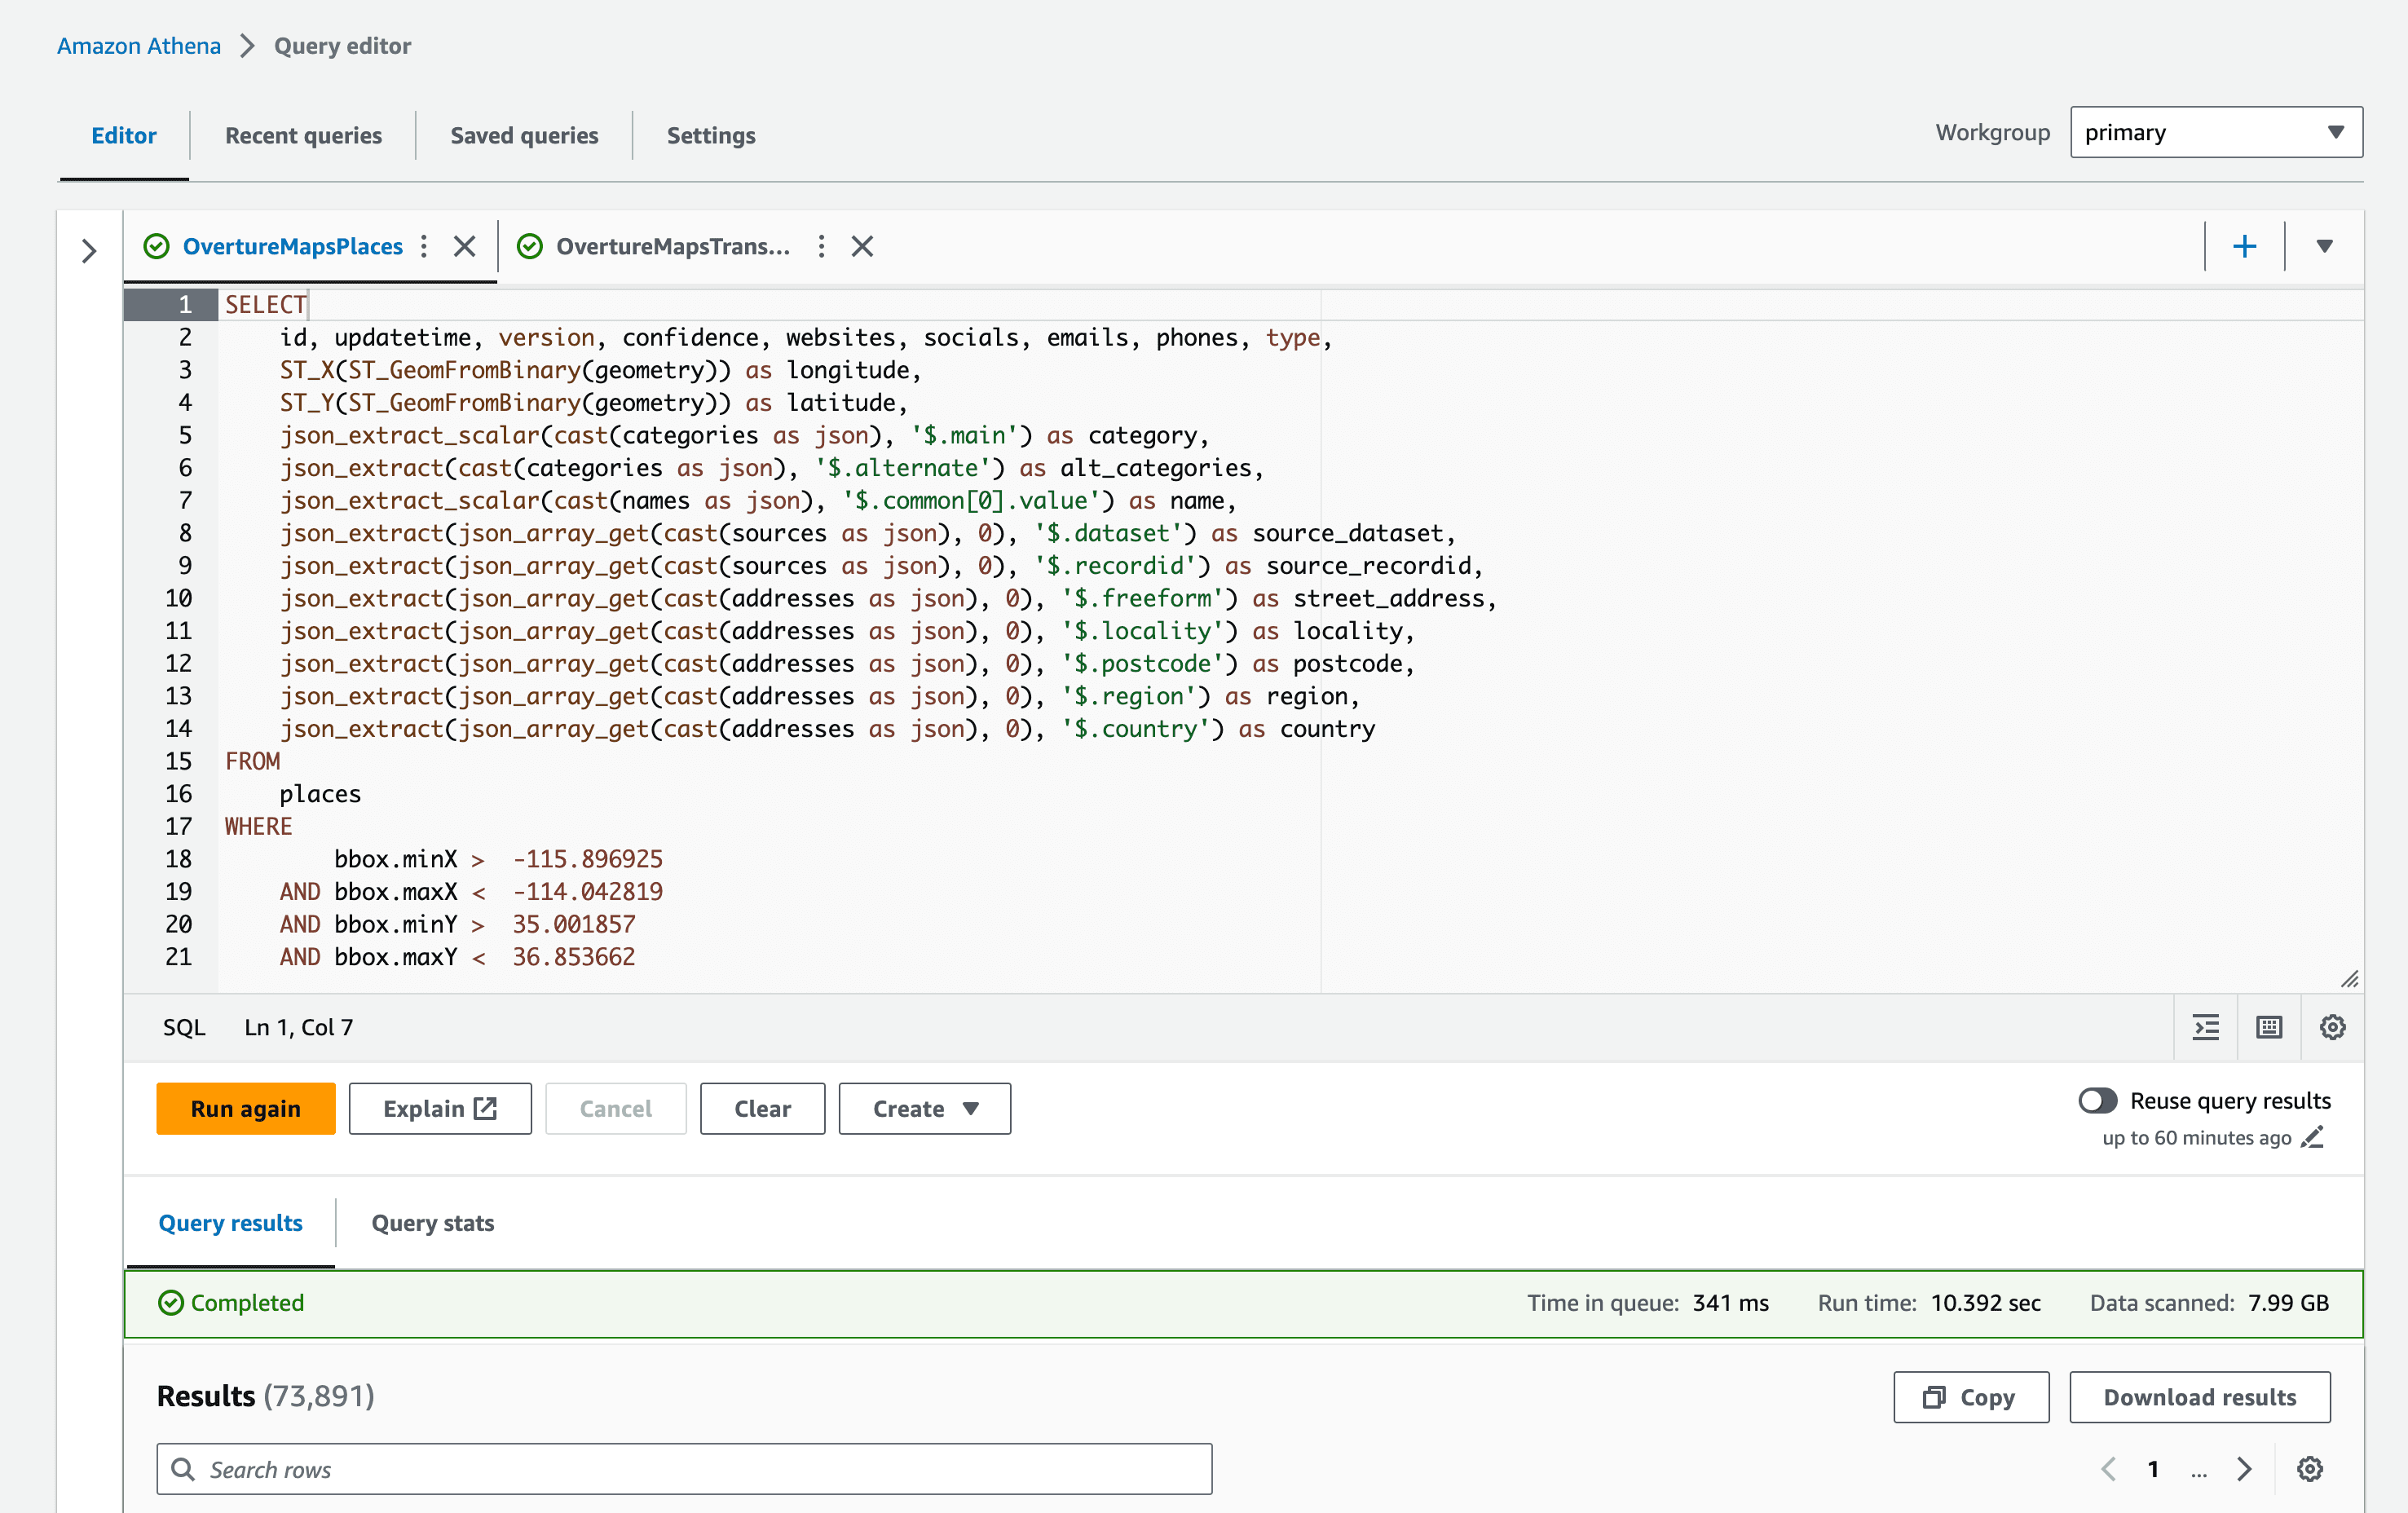
In the AWS Athena console we can select "Download data" to download a CSV file of the results. The file is 26Mb and has about 75k rows.
| "id" | "updatetime" | "version" | "confidence" | "websites" | "socials" | "emails" | "phones" | "type" | "longitude" | "latitude" | "category" | "alt_categories" | "name" | "source_dataset" | "source_recordid" | "street_address" | "locality" | "postcode" | "region" | "country" | | -------------------------------------- | ------------------------- | --------- | --------------------- | ------------------------------------------ | -------------------------------------------- | -------- | ---------------- | ------- | -------------- | ------------ | ---------------- | ---------------------------------------- | ------------------------------- | ---------------- | ---------------------- | ------------------------------- | ------------------ | ---------------- | -------- | --------- | | "tmp_9A5E9AA9E18DB0FD734E236DBEEB73B5" | "2023-07-24T00:00:00.000" | "0" | "0.5052741765975952" | | "[https://www.facebook.com/140308446009738]" | | | "place" | "-114.3012956" | "35.5715668" | "restaurant" | "[""landmark_and_historical_building""]" | "Lake Mohave Ranchos Airport" | """meta""" | """140308446009738""" | | | | | | "tmp_7BCFD4C7C12B83CD5355AE15F5A3F262" | "2023-07-24T00:00:00.000" | "0" | "0.6" | | | | | "place" | "-115.0231676" | "36.0496907" | | "null" | "Local Vape" | """msft""" | """1970324838862842""" | """7685 Commercial Way Ste I""" | """Henderson""" | """89011""" | """NV""" | """US""" | | "tmp_FF0104AF0B2048DCD02320B4A096A398" | "2023-07-24T00:00:00.000" | "0" | "0.26928654313087463" | "[http://ombremonai.com]" | "[https://www.facebook.com/108034485157293]" | | "[+17029101015]" | "place" | "-115.28665" | "36.15881" | "beauty_and_spa" | "null" | "Ombré Monai" | """meta""" | """108034485157293""" | """8751 W Charleston Blvd""" | """Las Vegas""" | """89117-5453""" | """NV""" | """US""" | | "tmp_D57D0159A70E965E96572CF6D596F1C1" | "2023-07-24T00:00:00.000" | "0" | "0.8260171413421631" | "[https://nevadasouthernlivesteamers.com]" | "[https://www.facebook.com/475380855987545]" | | "[+17023757089]" | "place" | "-114.8539342" | "35.9706829" | "museum" | "[""history_museum"",""train_station""]" | "Nevada Southern Live Steamers" | """meta""" | """475380855987545""" | """601 Yucca St""" | """Boulder City""" | """89005""" | """NV""" | """US""" |
With our CSV file of points of interest downloaded, let's head over to Neo4j Aura and spin up a free Neo4j instance in the cloud to analyze our place data. After signing in and creating a free tier Neo4j Aura instance we'll use the "Import" tab to create a property graph data model mapped to the places data in our CSV file.
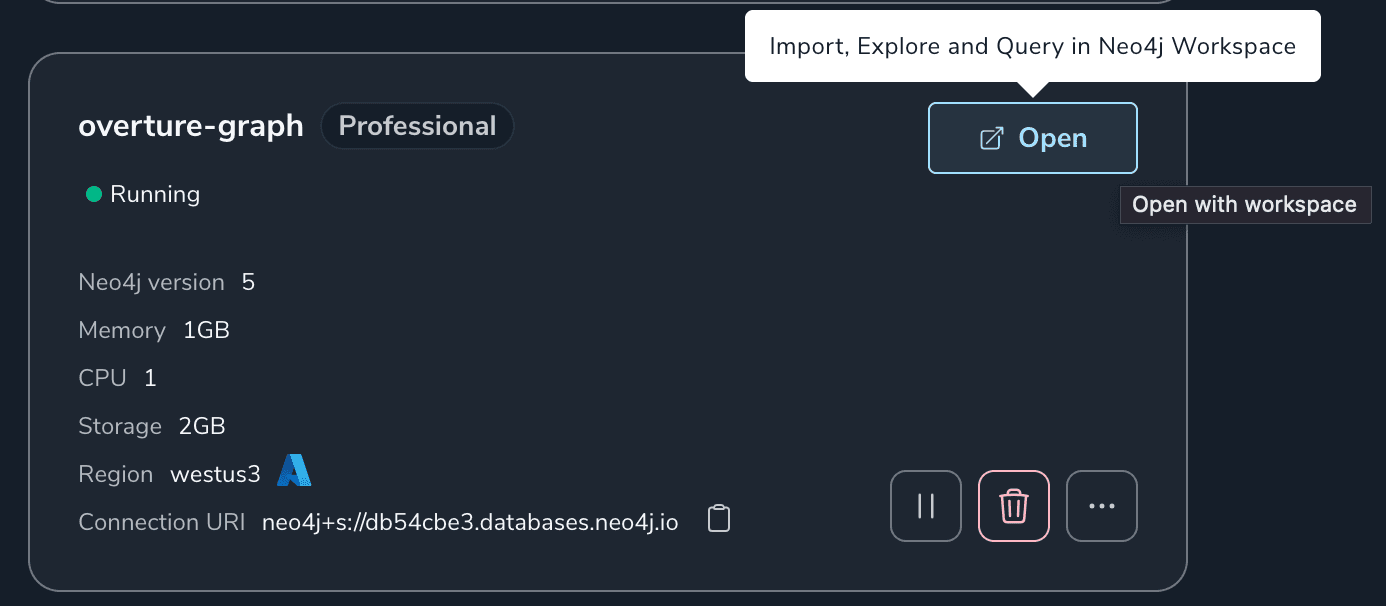
Data Import Tool#
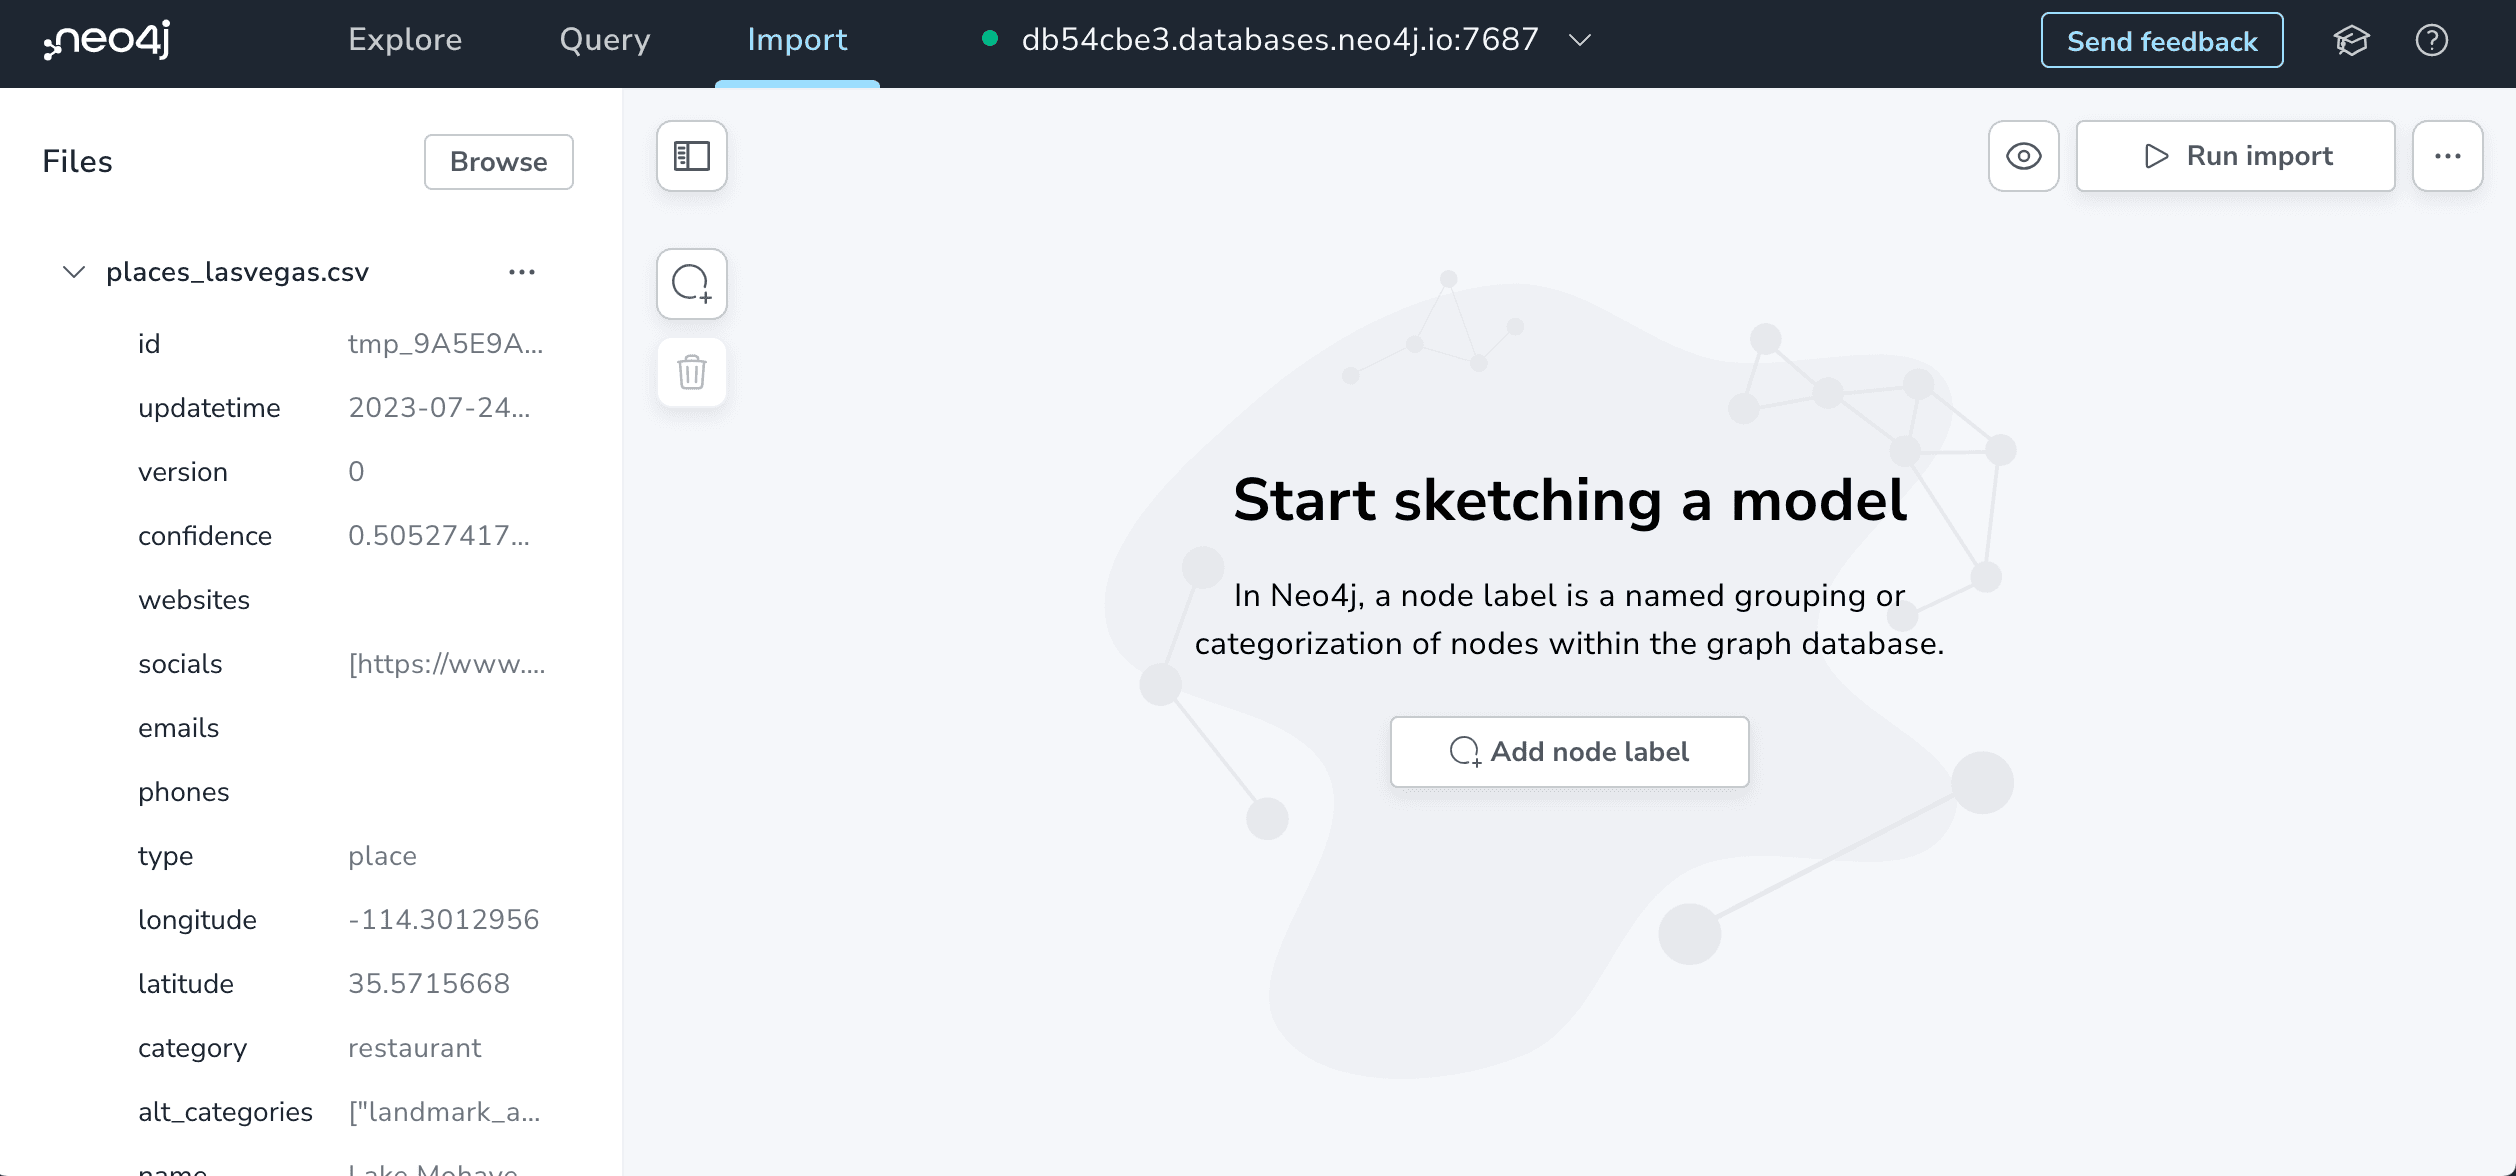
Neo4j Workspace's Import tool is designed around the idea of sketching your property graph data model in an interactive modern diagramming UI and mapping pieces of the data model diagram to fields in your CSV files.
I had worked on a similar web-based visual graph data import tool prototype when I first joined Neo4j 8 years ago so it's great to see this functionality available directly in Neo4j Aura.
We can start either by beginning to sketch our property graph data model as we would on a whiteboard, or by selecting the CSV file we want to import. We'll start by selecting the CSV file we downloaded from AWS Athena in the previous step.
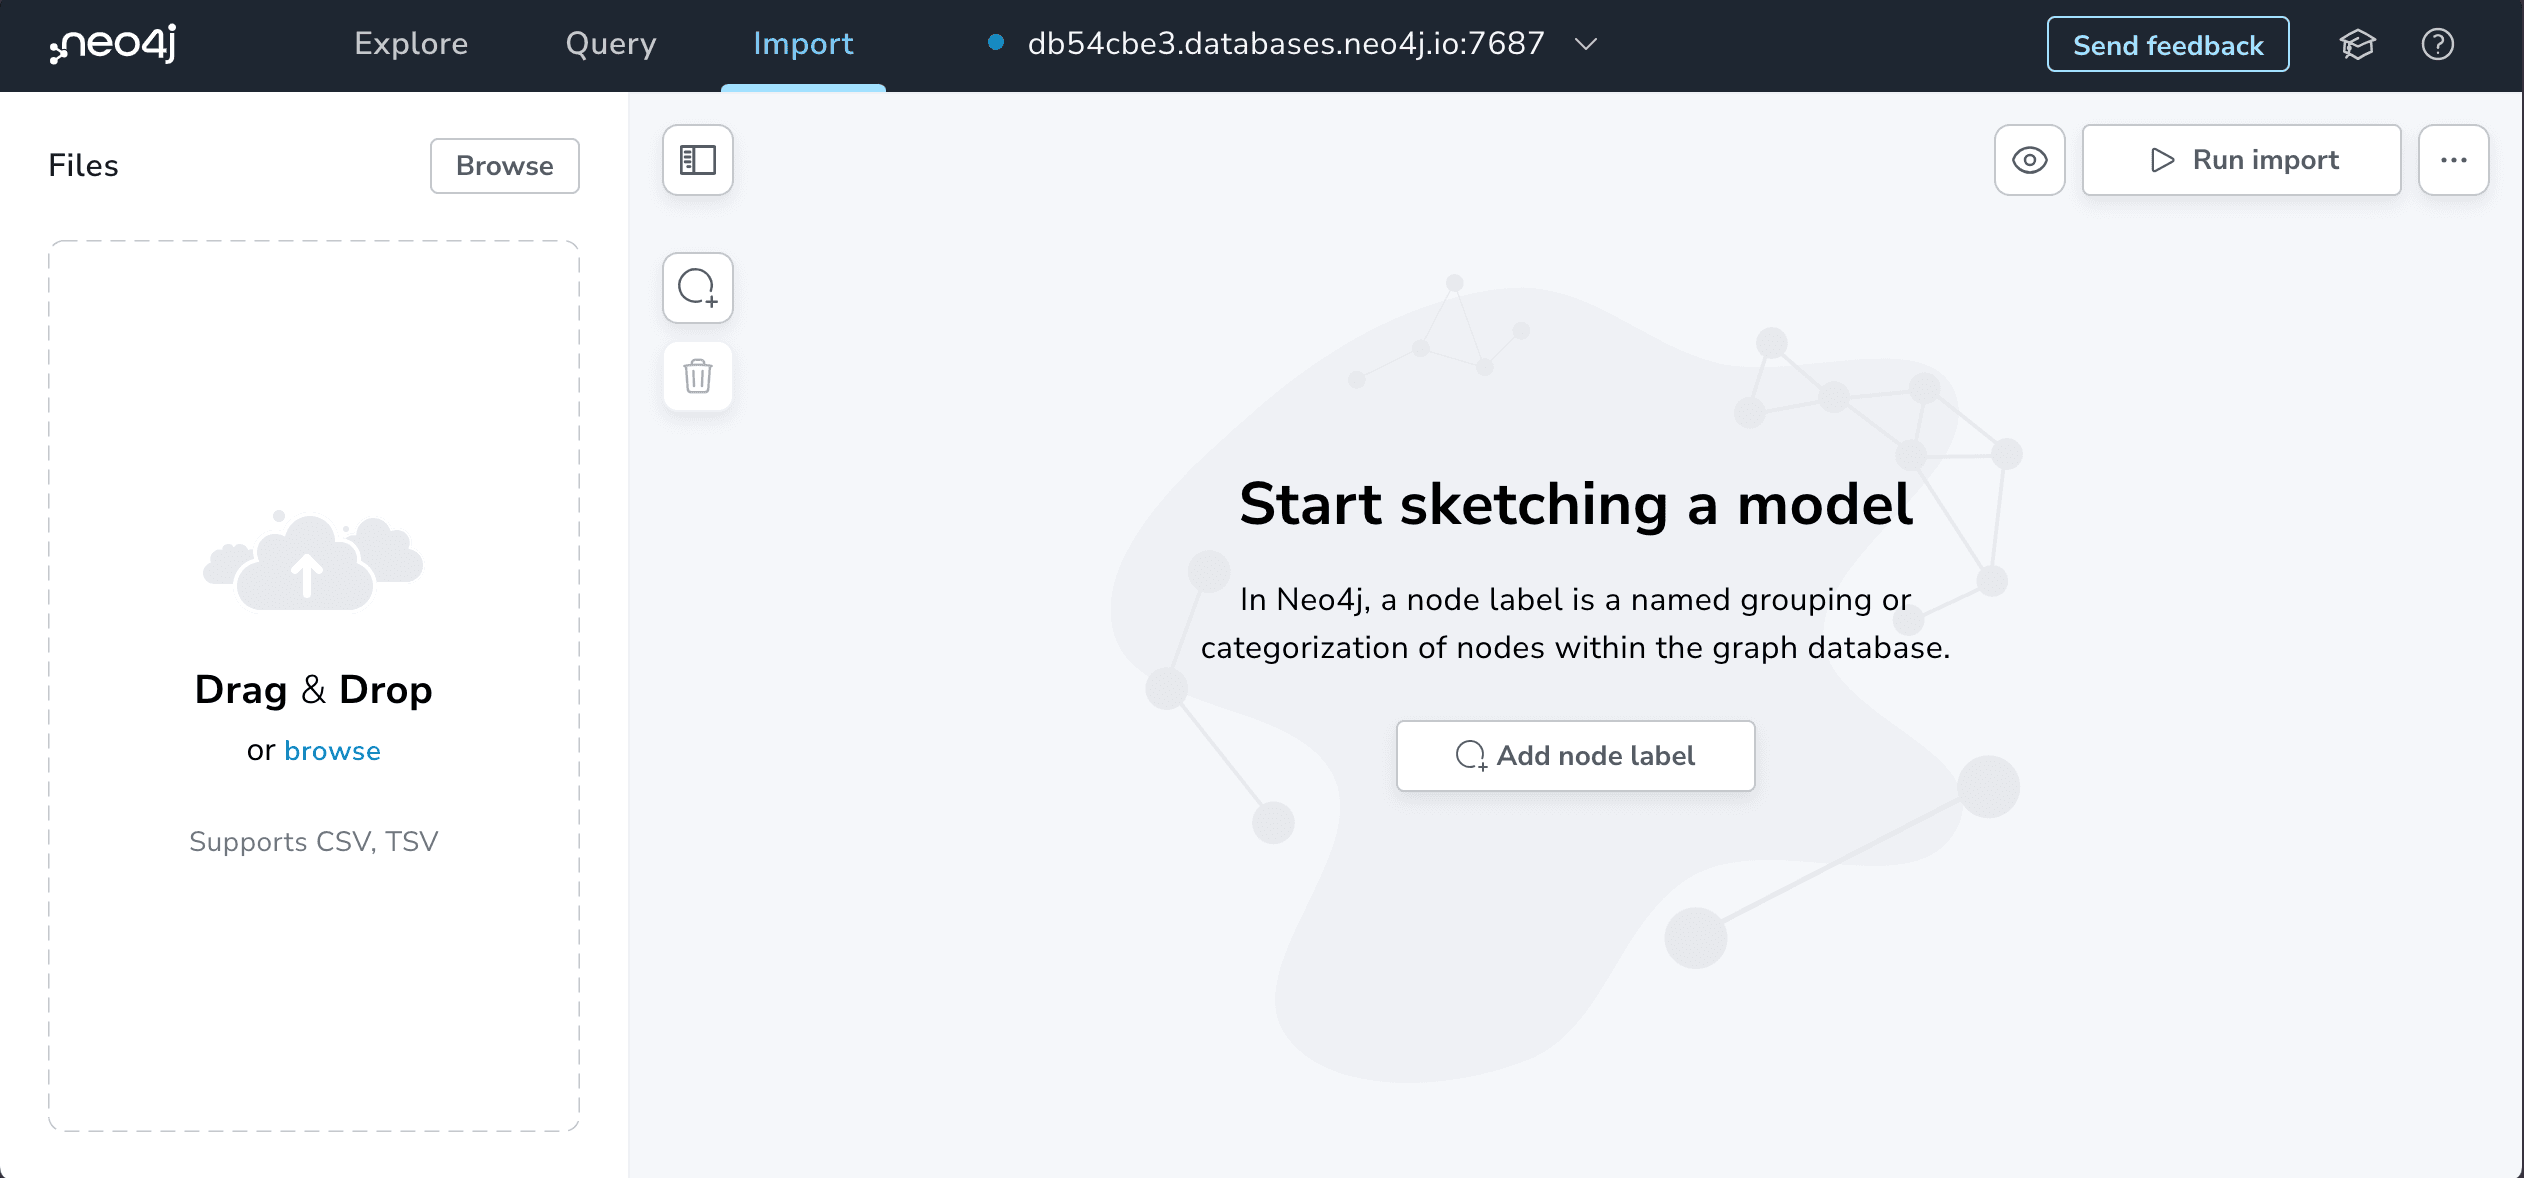
No data is sent to the server, but Import has parsed our CSV file and shows a preview of the values from the first row that we can use to reference when sketching our whiteboard graph model.
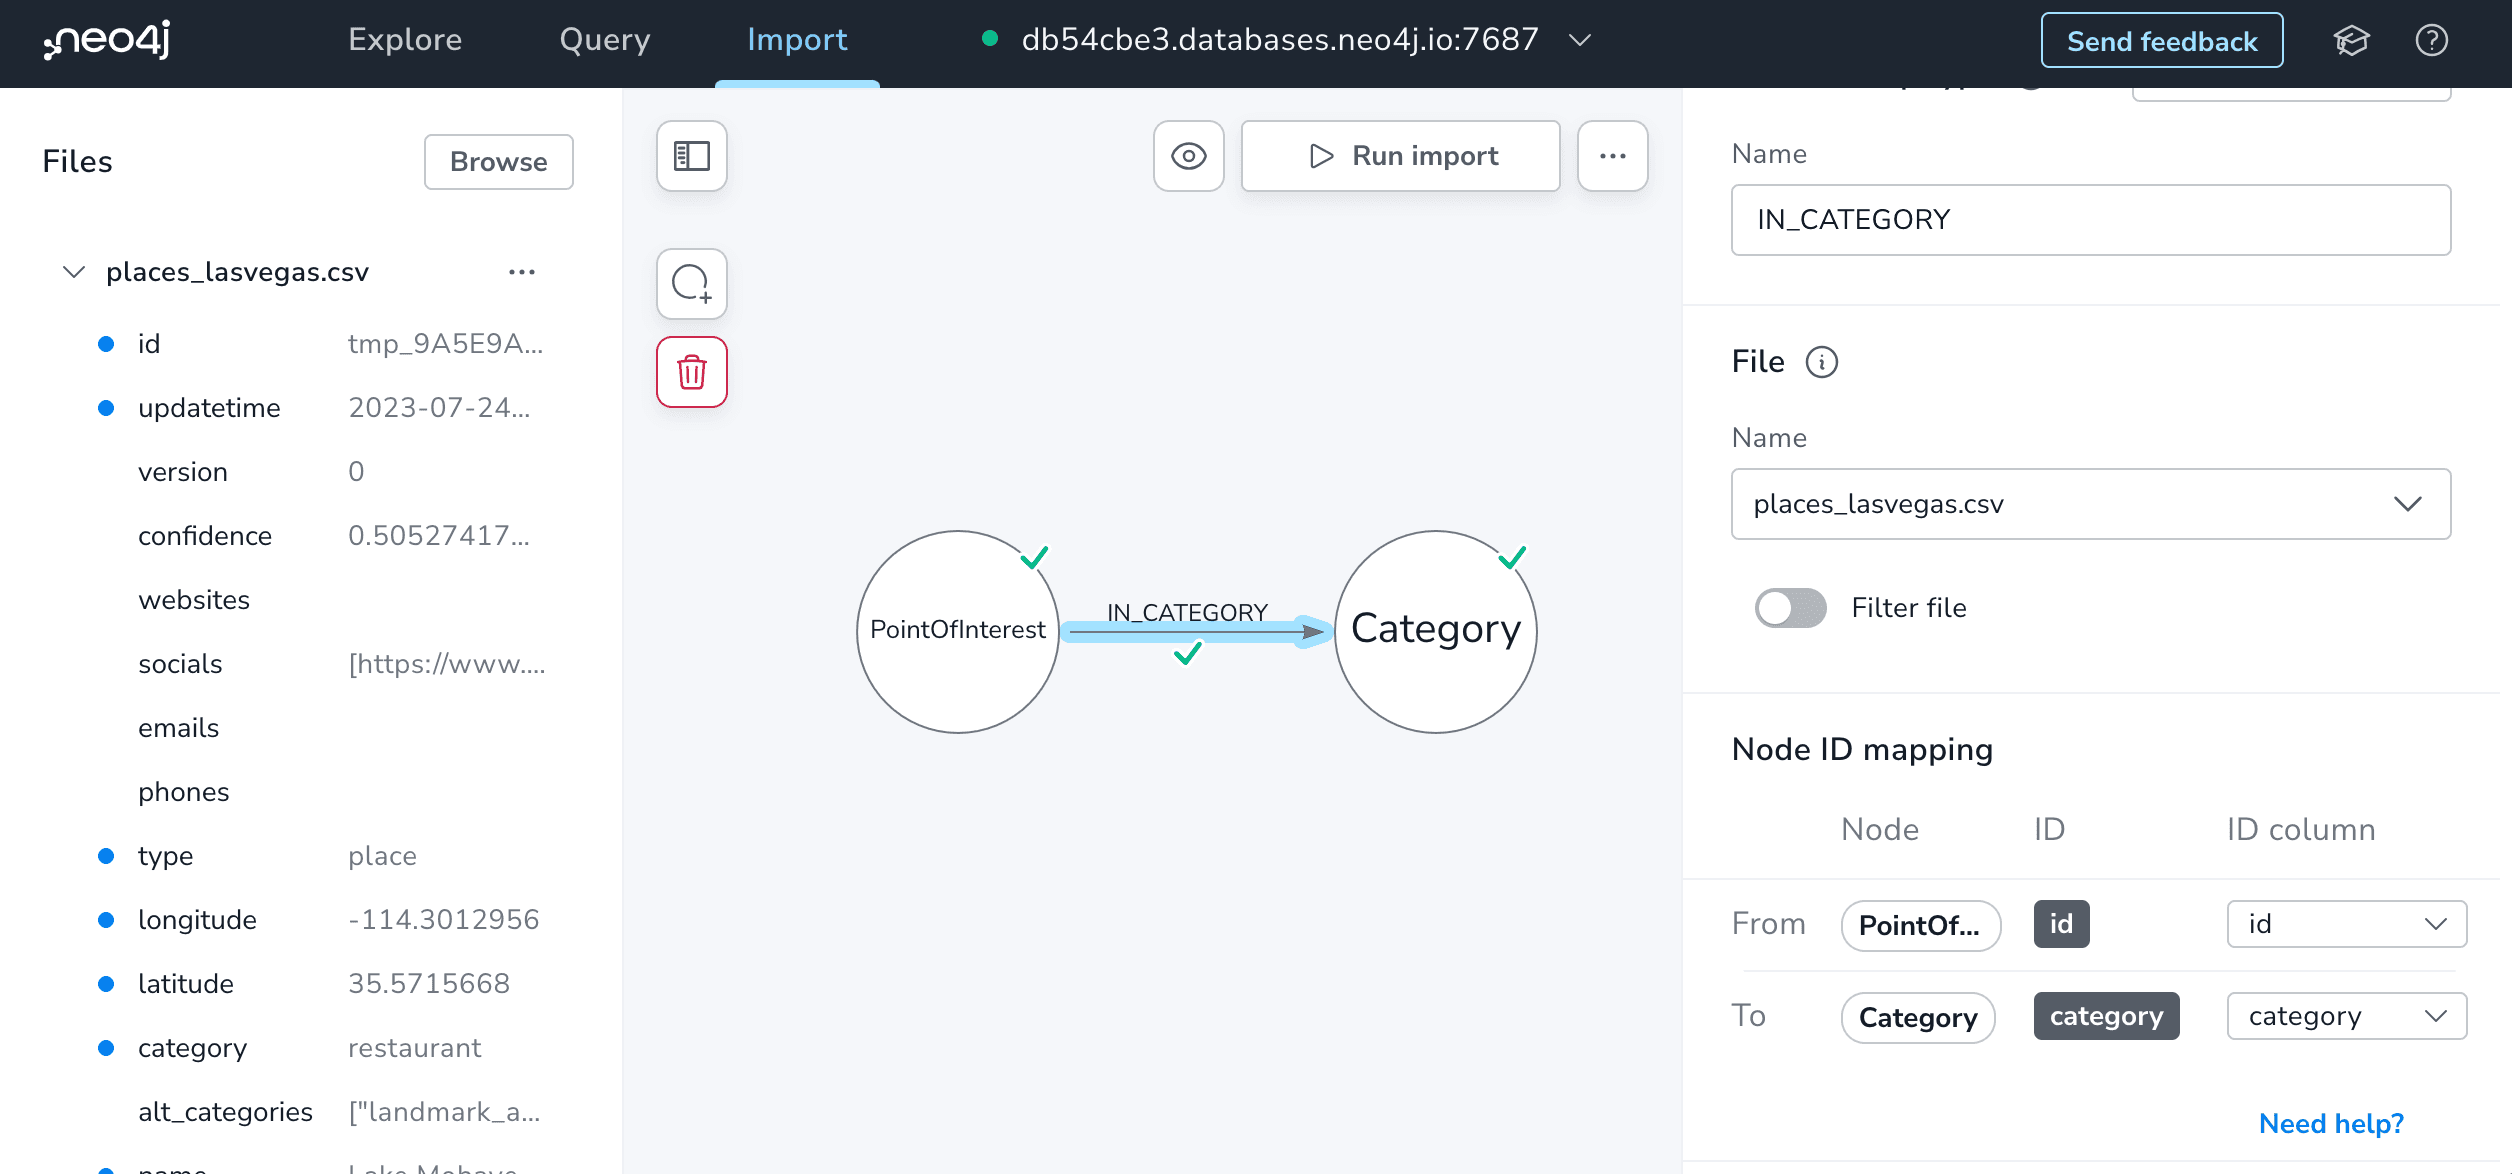
If we select the "Add node label" button we can add our first node to the diagram. Let's use this first node label to represent the places of interest themselves so we'll call this node label PointOfInterest.
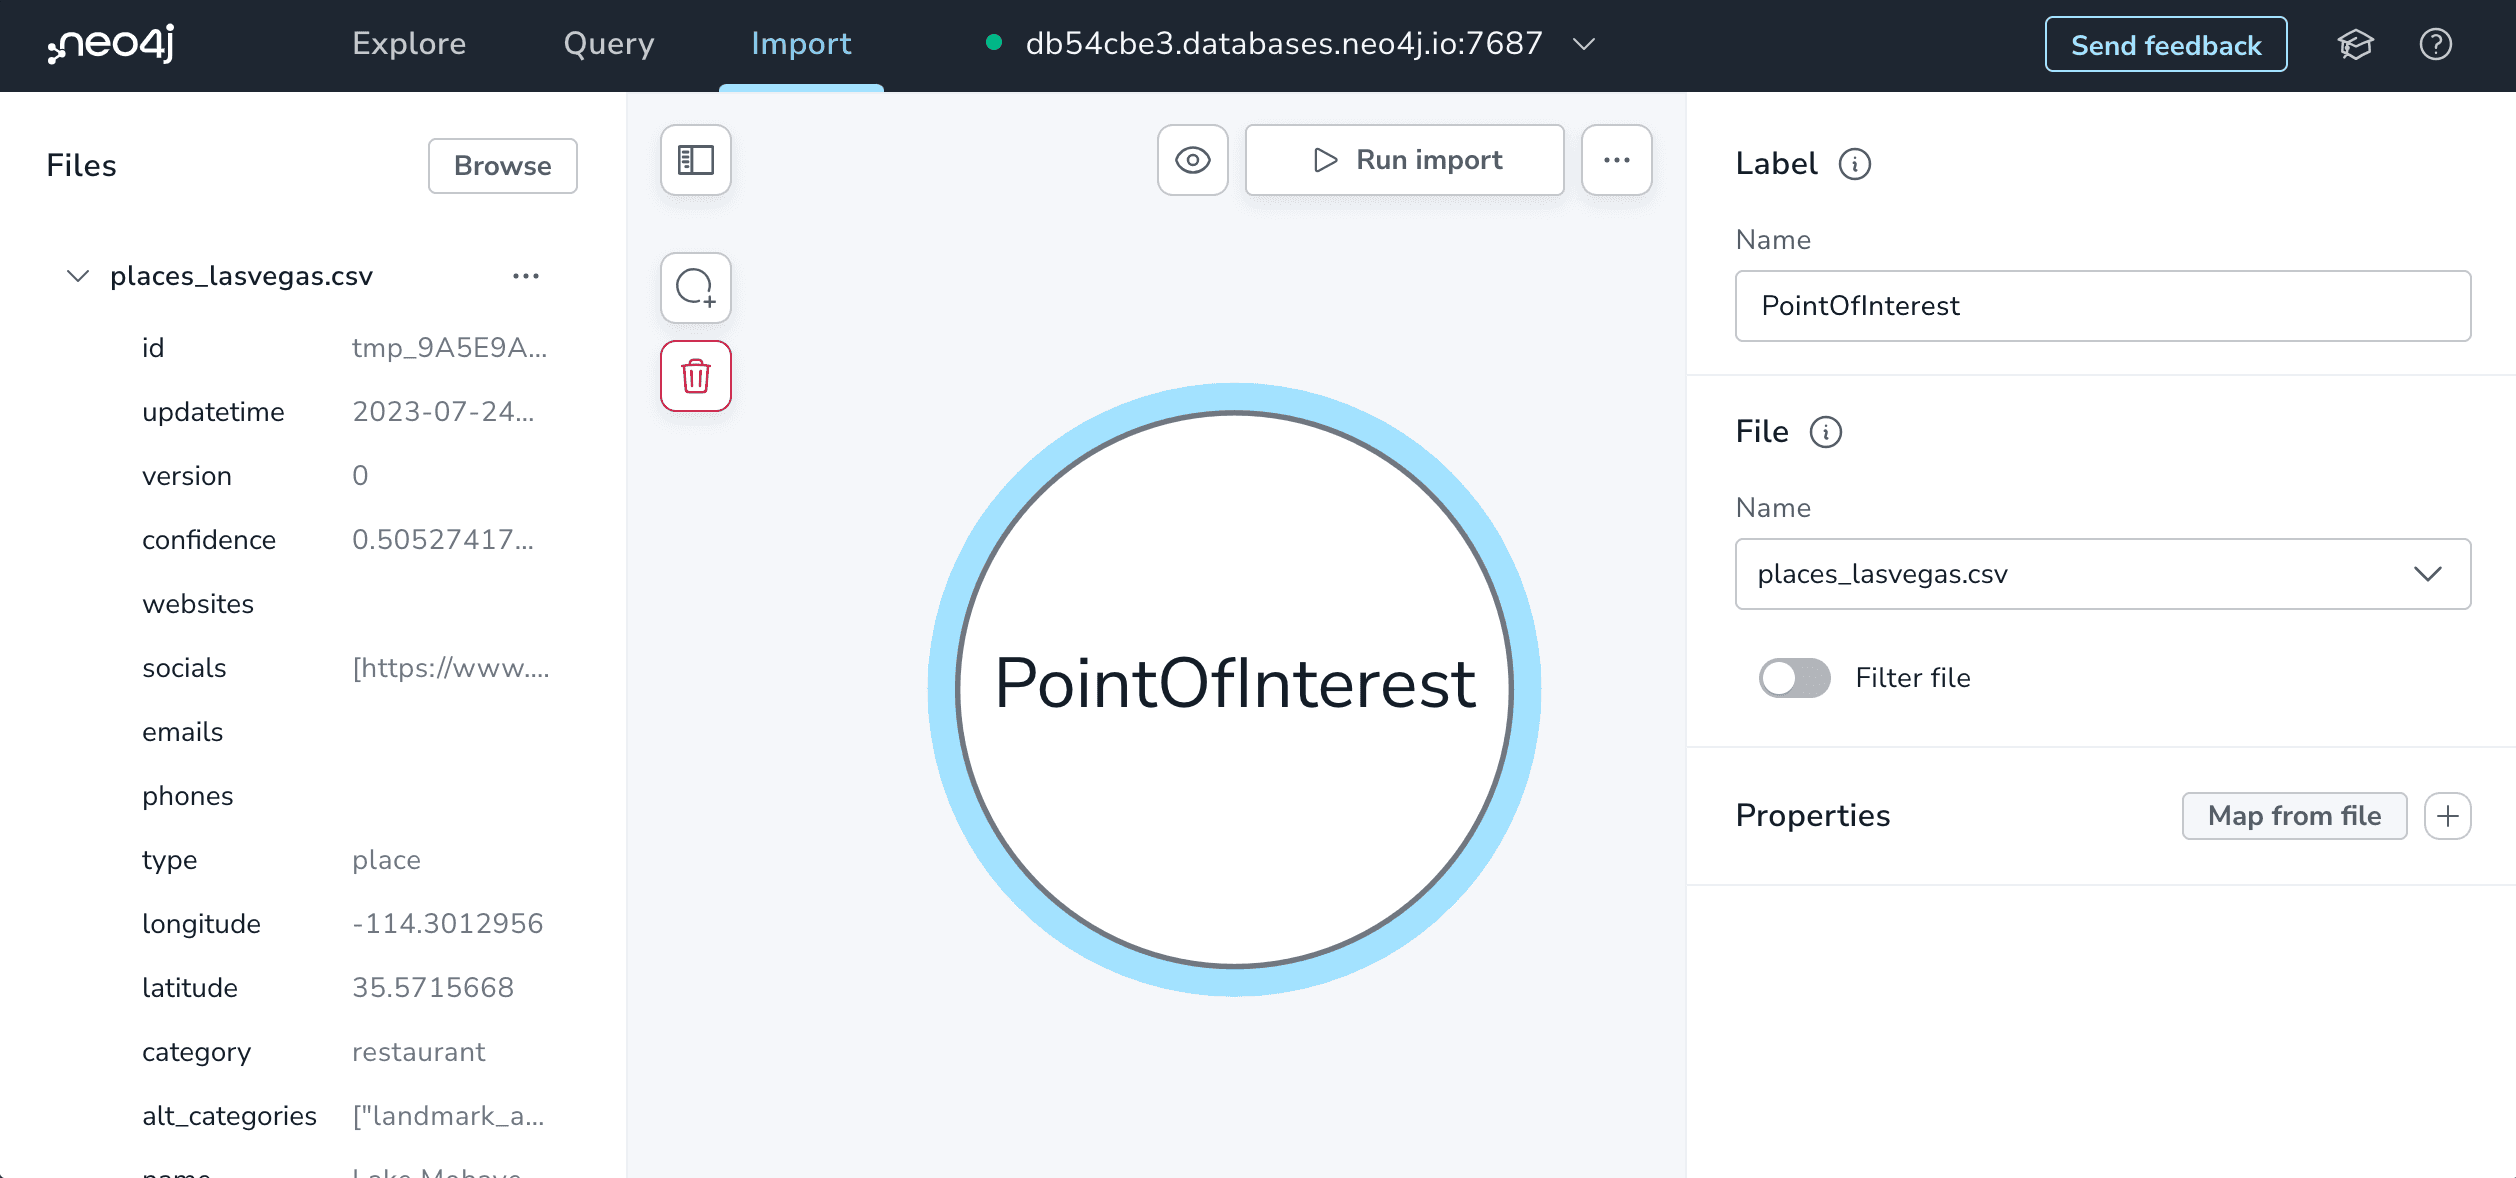
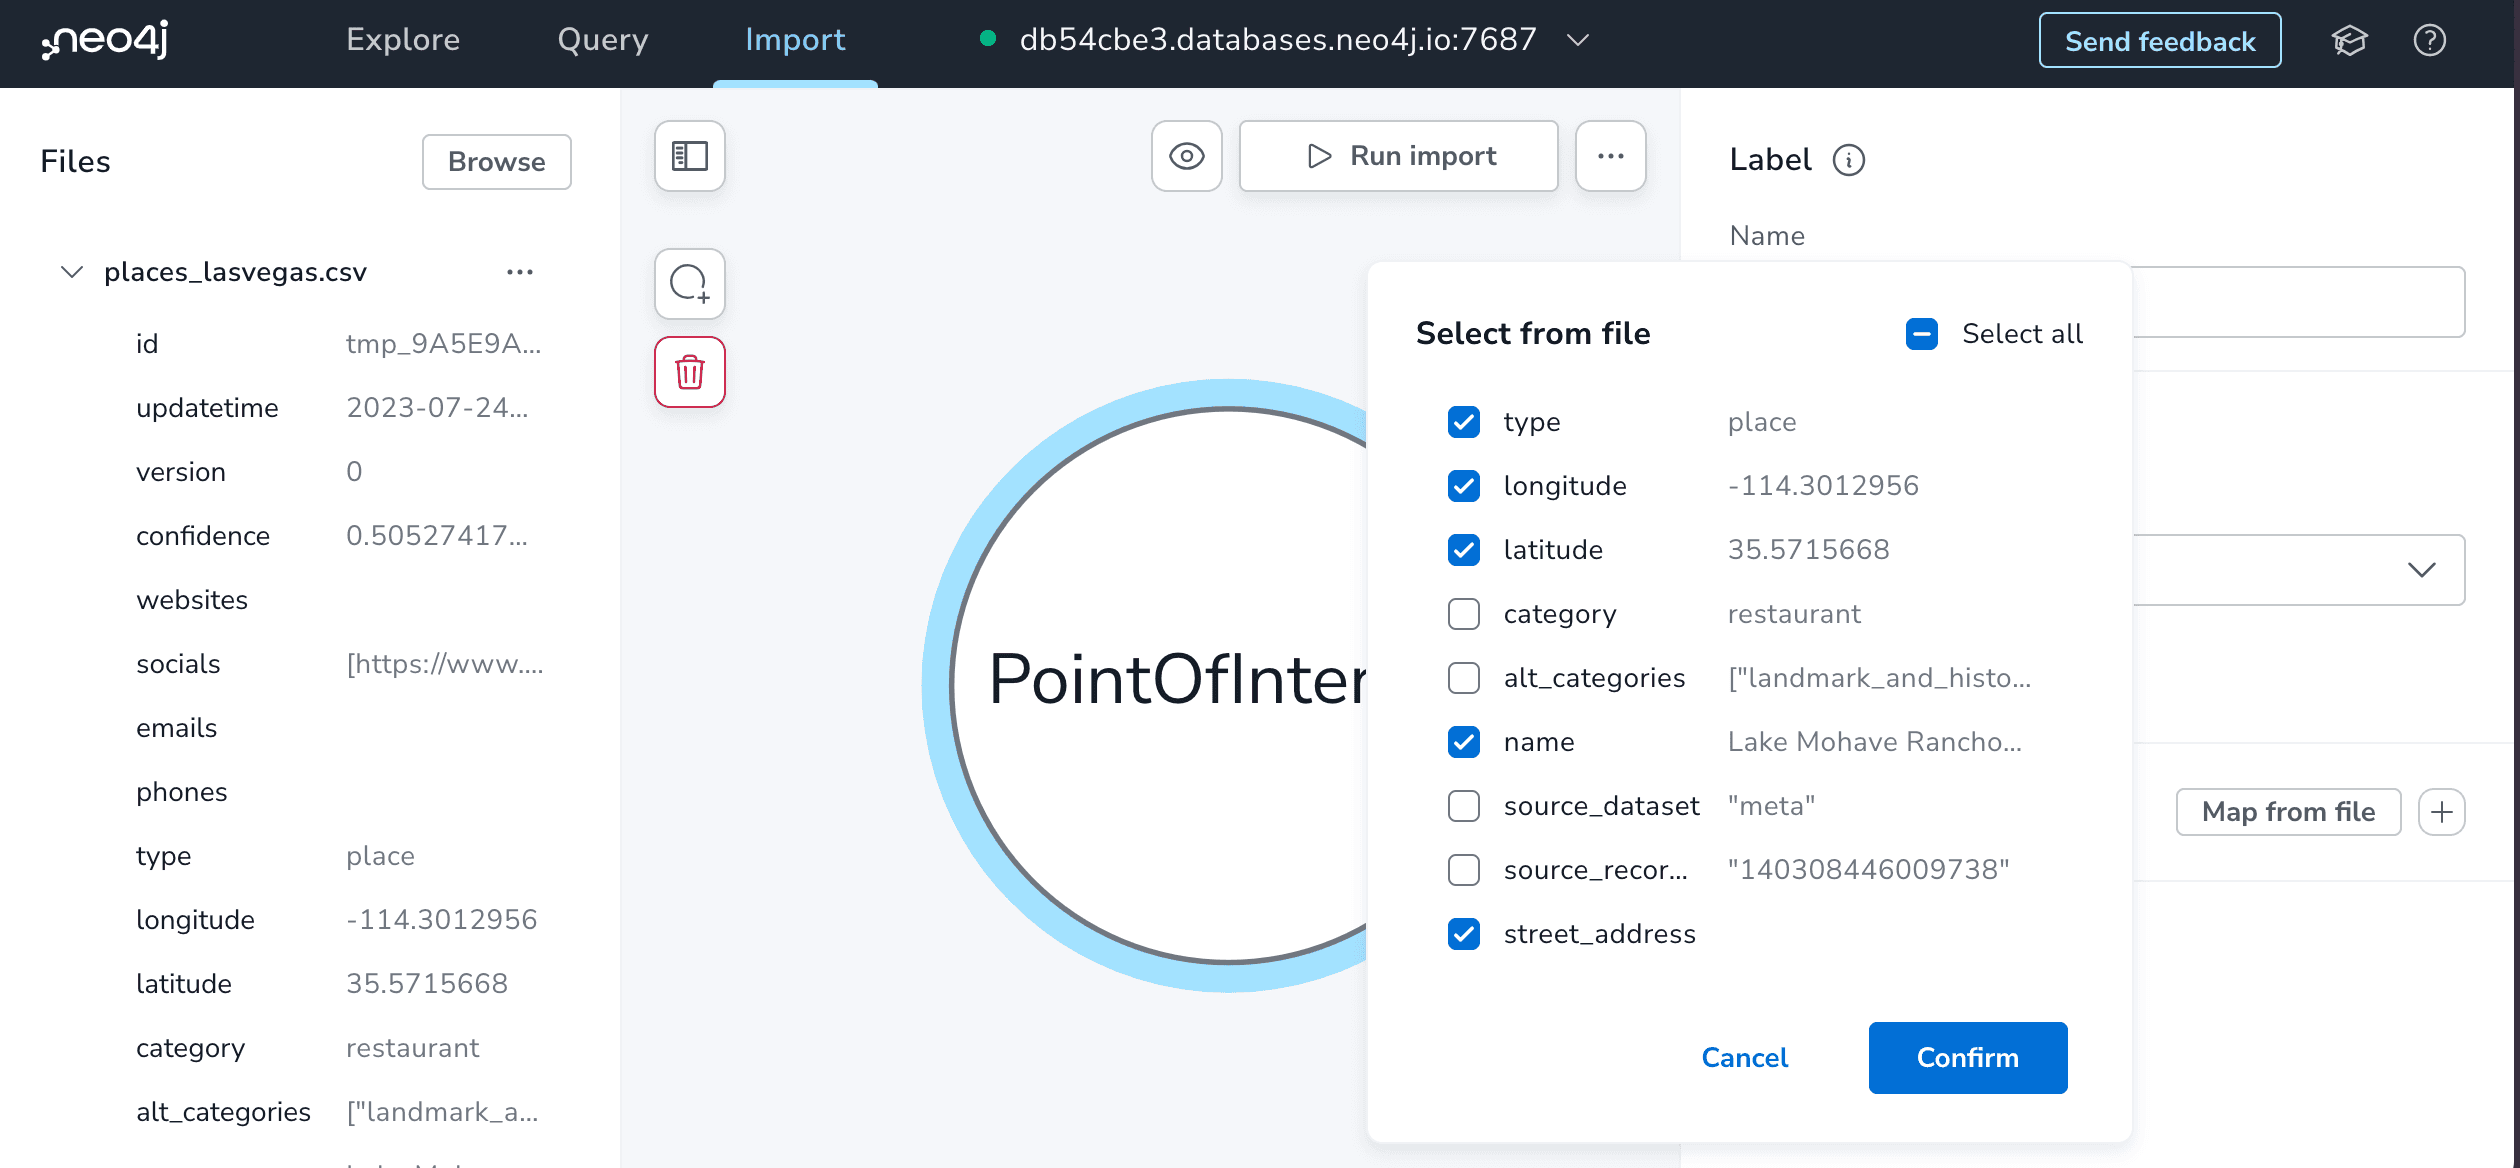
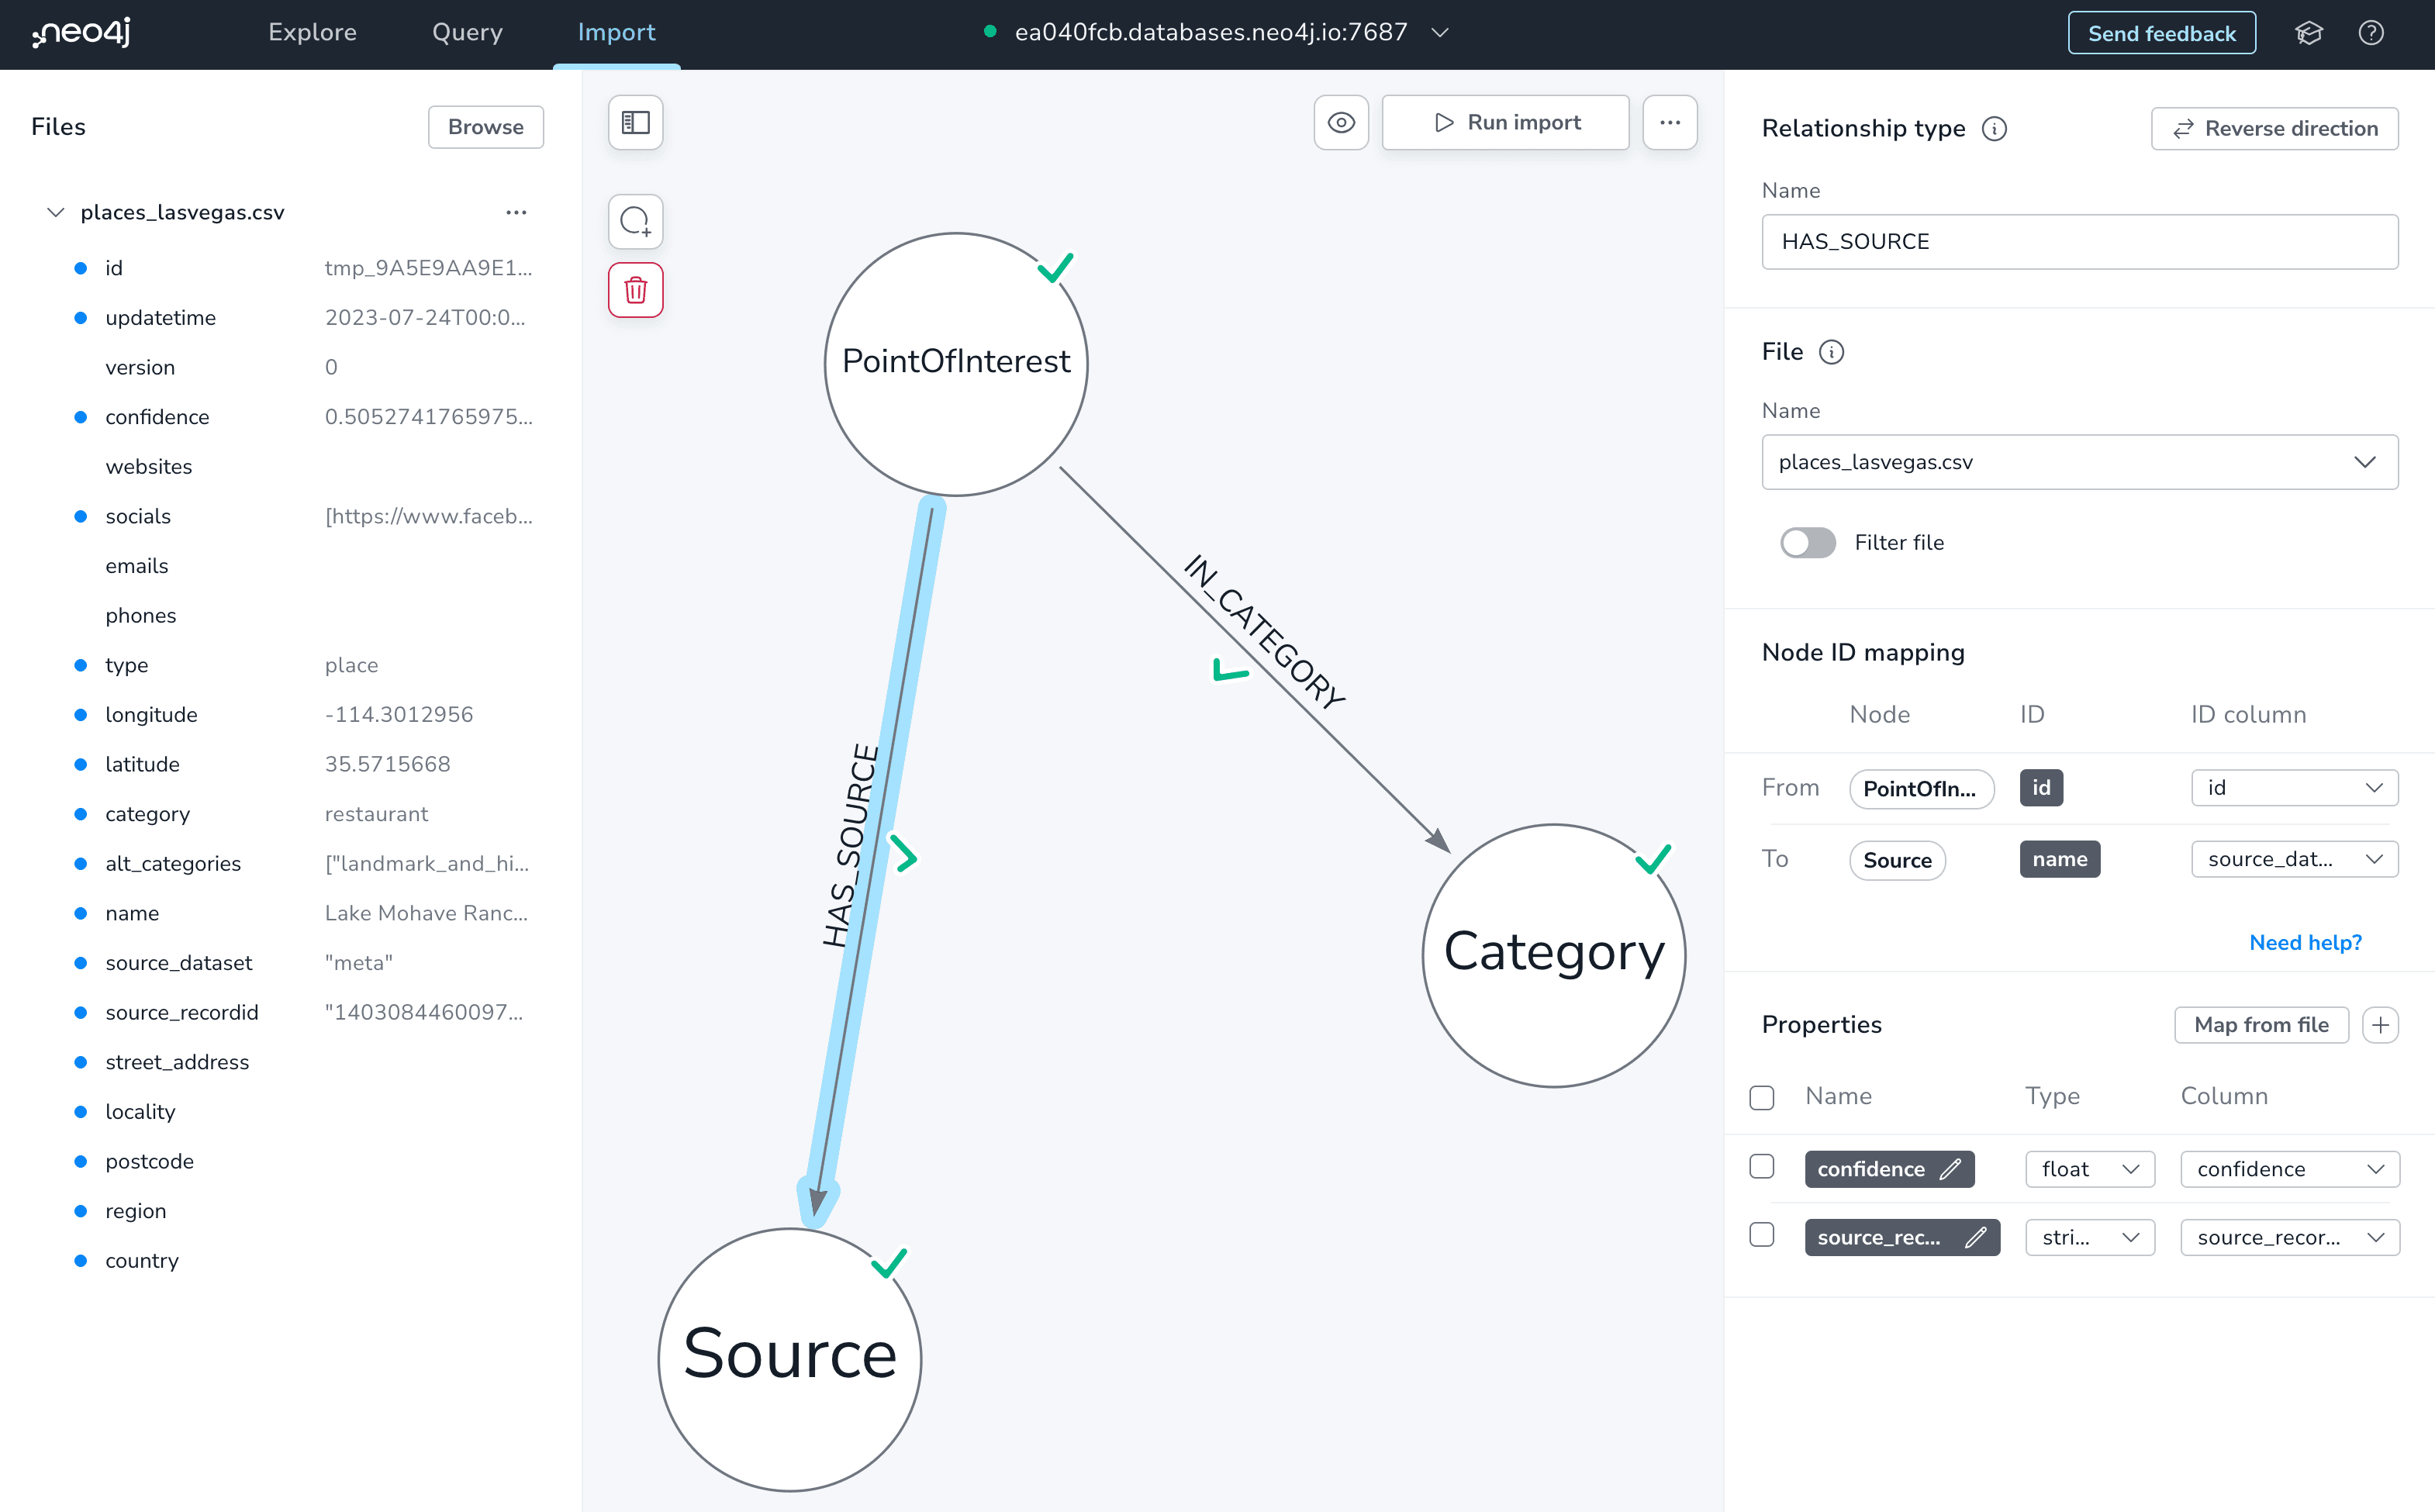
Next, we'll want to specify the properties to include on our PointOfInterest nodes from the CSV file. Some of the fields from our CSV file will be extracted out into nodes and relationships of their own (like category, source, and location information) so we don't want to include all fields from the CSV.
We also choose the type of each field and importantly also specify which field defines uniqueness for the node. In other words, which field is the "id" value. In the relational database world this is similar to the concept of "primary key". We need to specify this property to be able to define relationships in our graph.
Adding relationships to the data model is as simple as dragging out from the halo around a node.
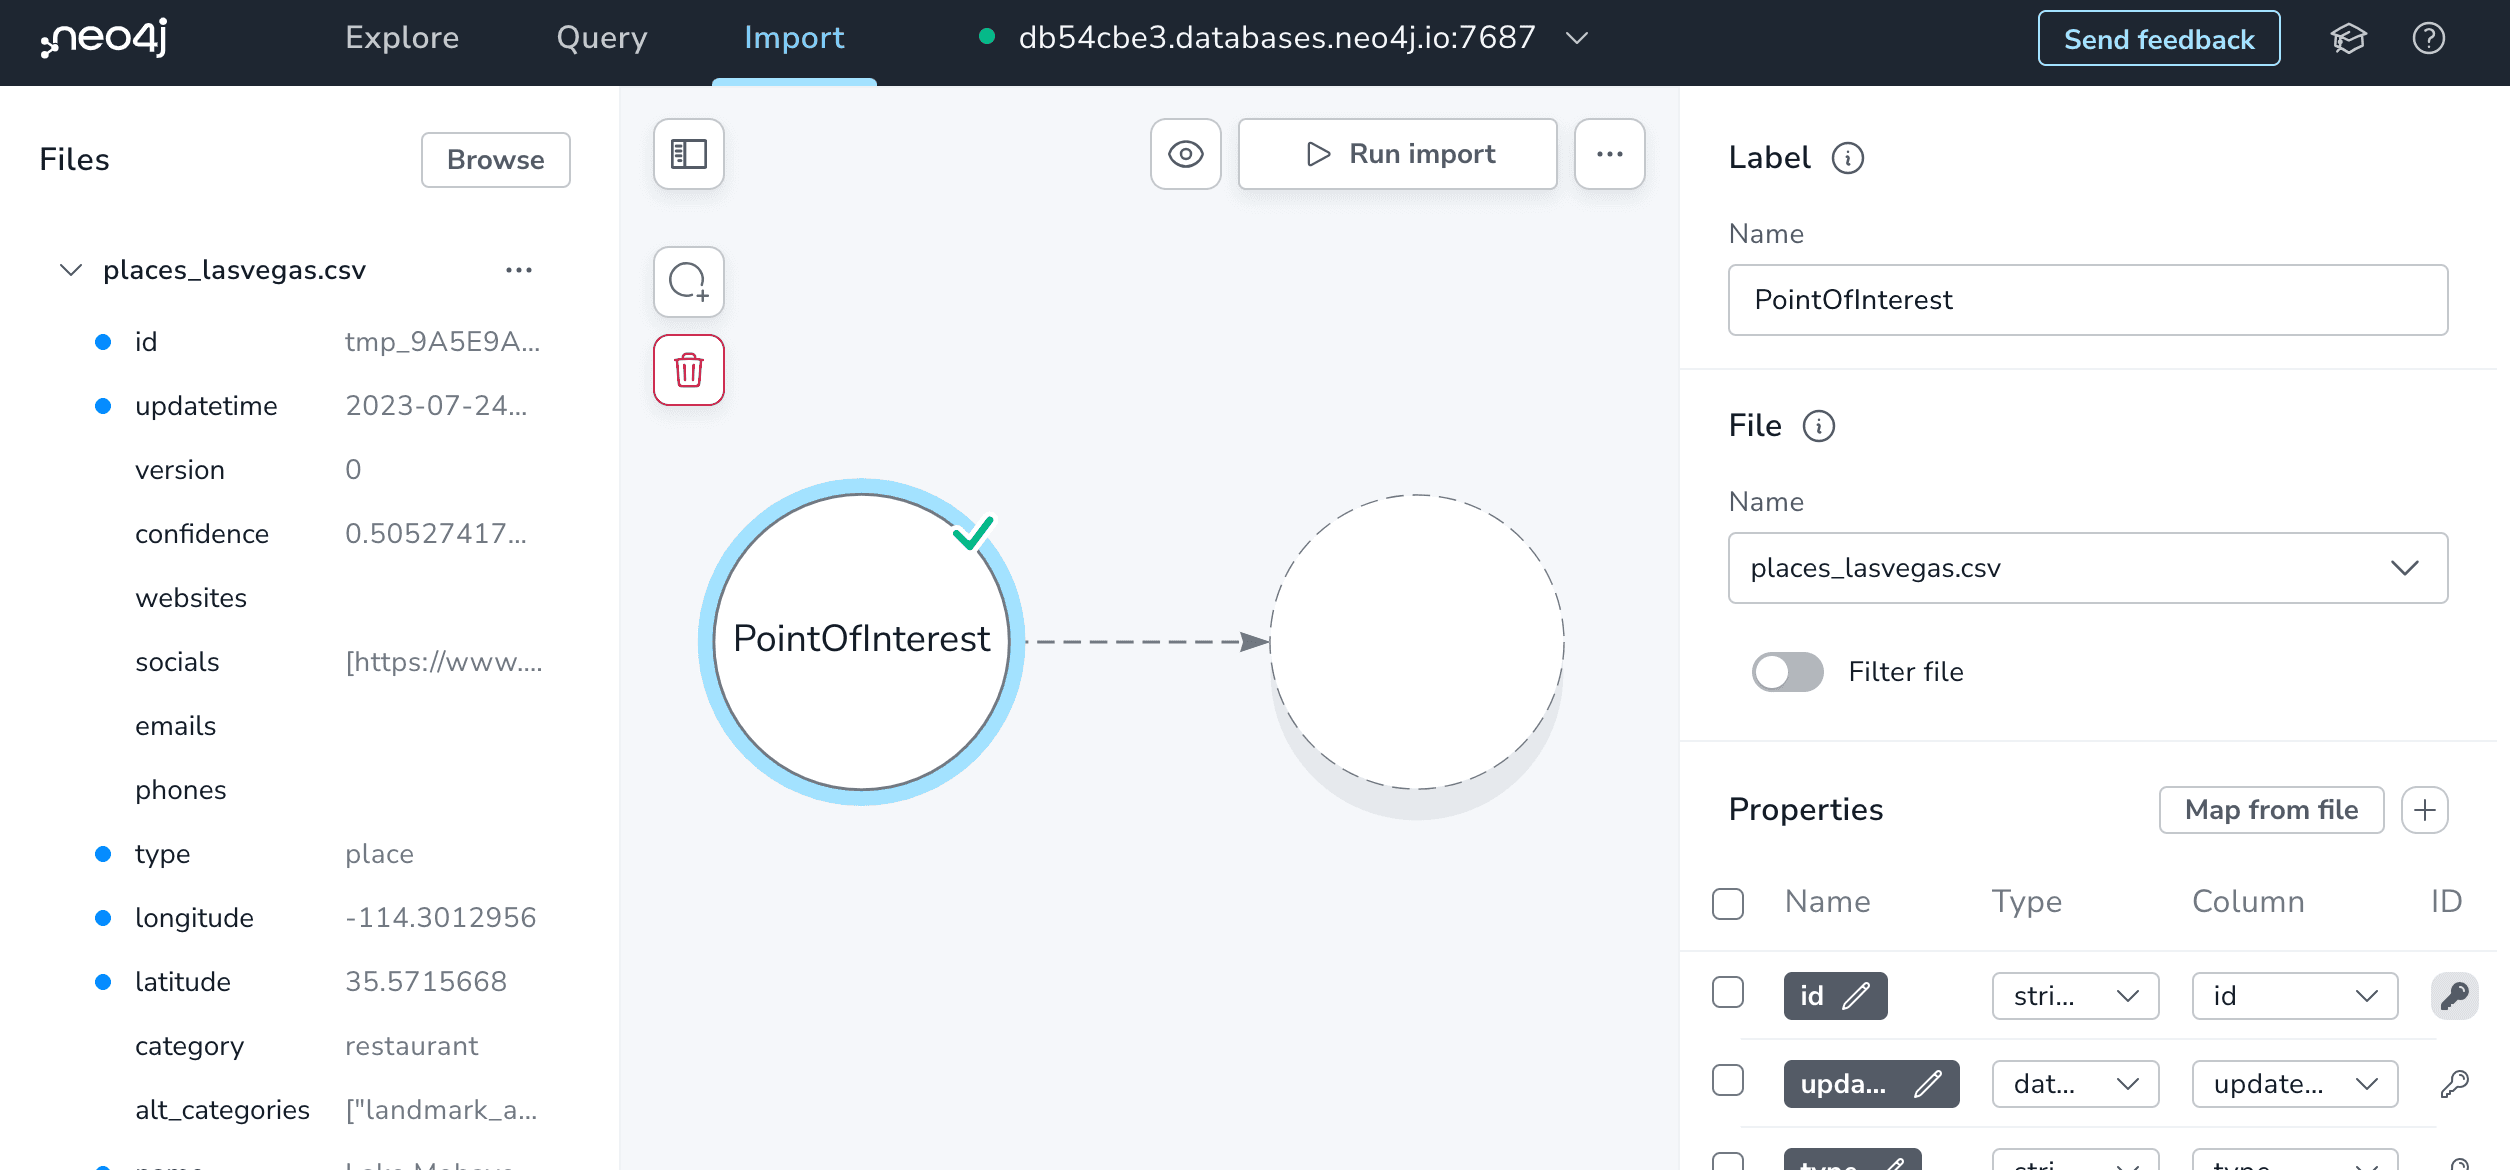
In the labeled property graph model used by Neo4j every relationship has both a direction and single "type" that describes the relationship between the two node labels that it connects. We can add the relationship type by clicking on the dashed relationship line.
Since this relationship connects the PointOfInterest and Category node labels let's define the relationship type as IN_CATEGORY. By convention PascalCase is used when defining node lables and ALL_CAPS_SNAKE_CASE is used for relationship types. You can find more Cypher style guidelines here.
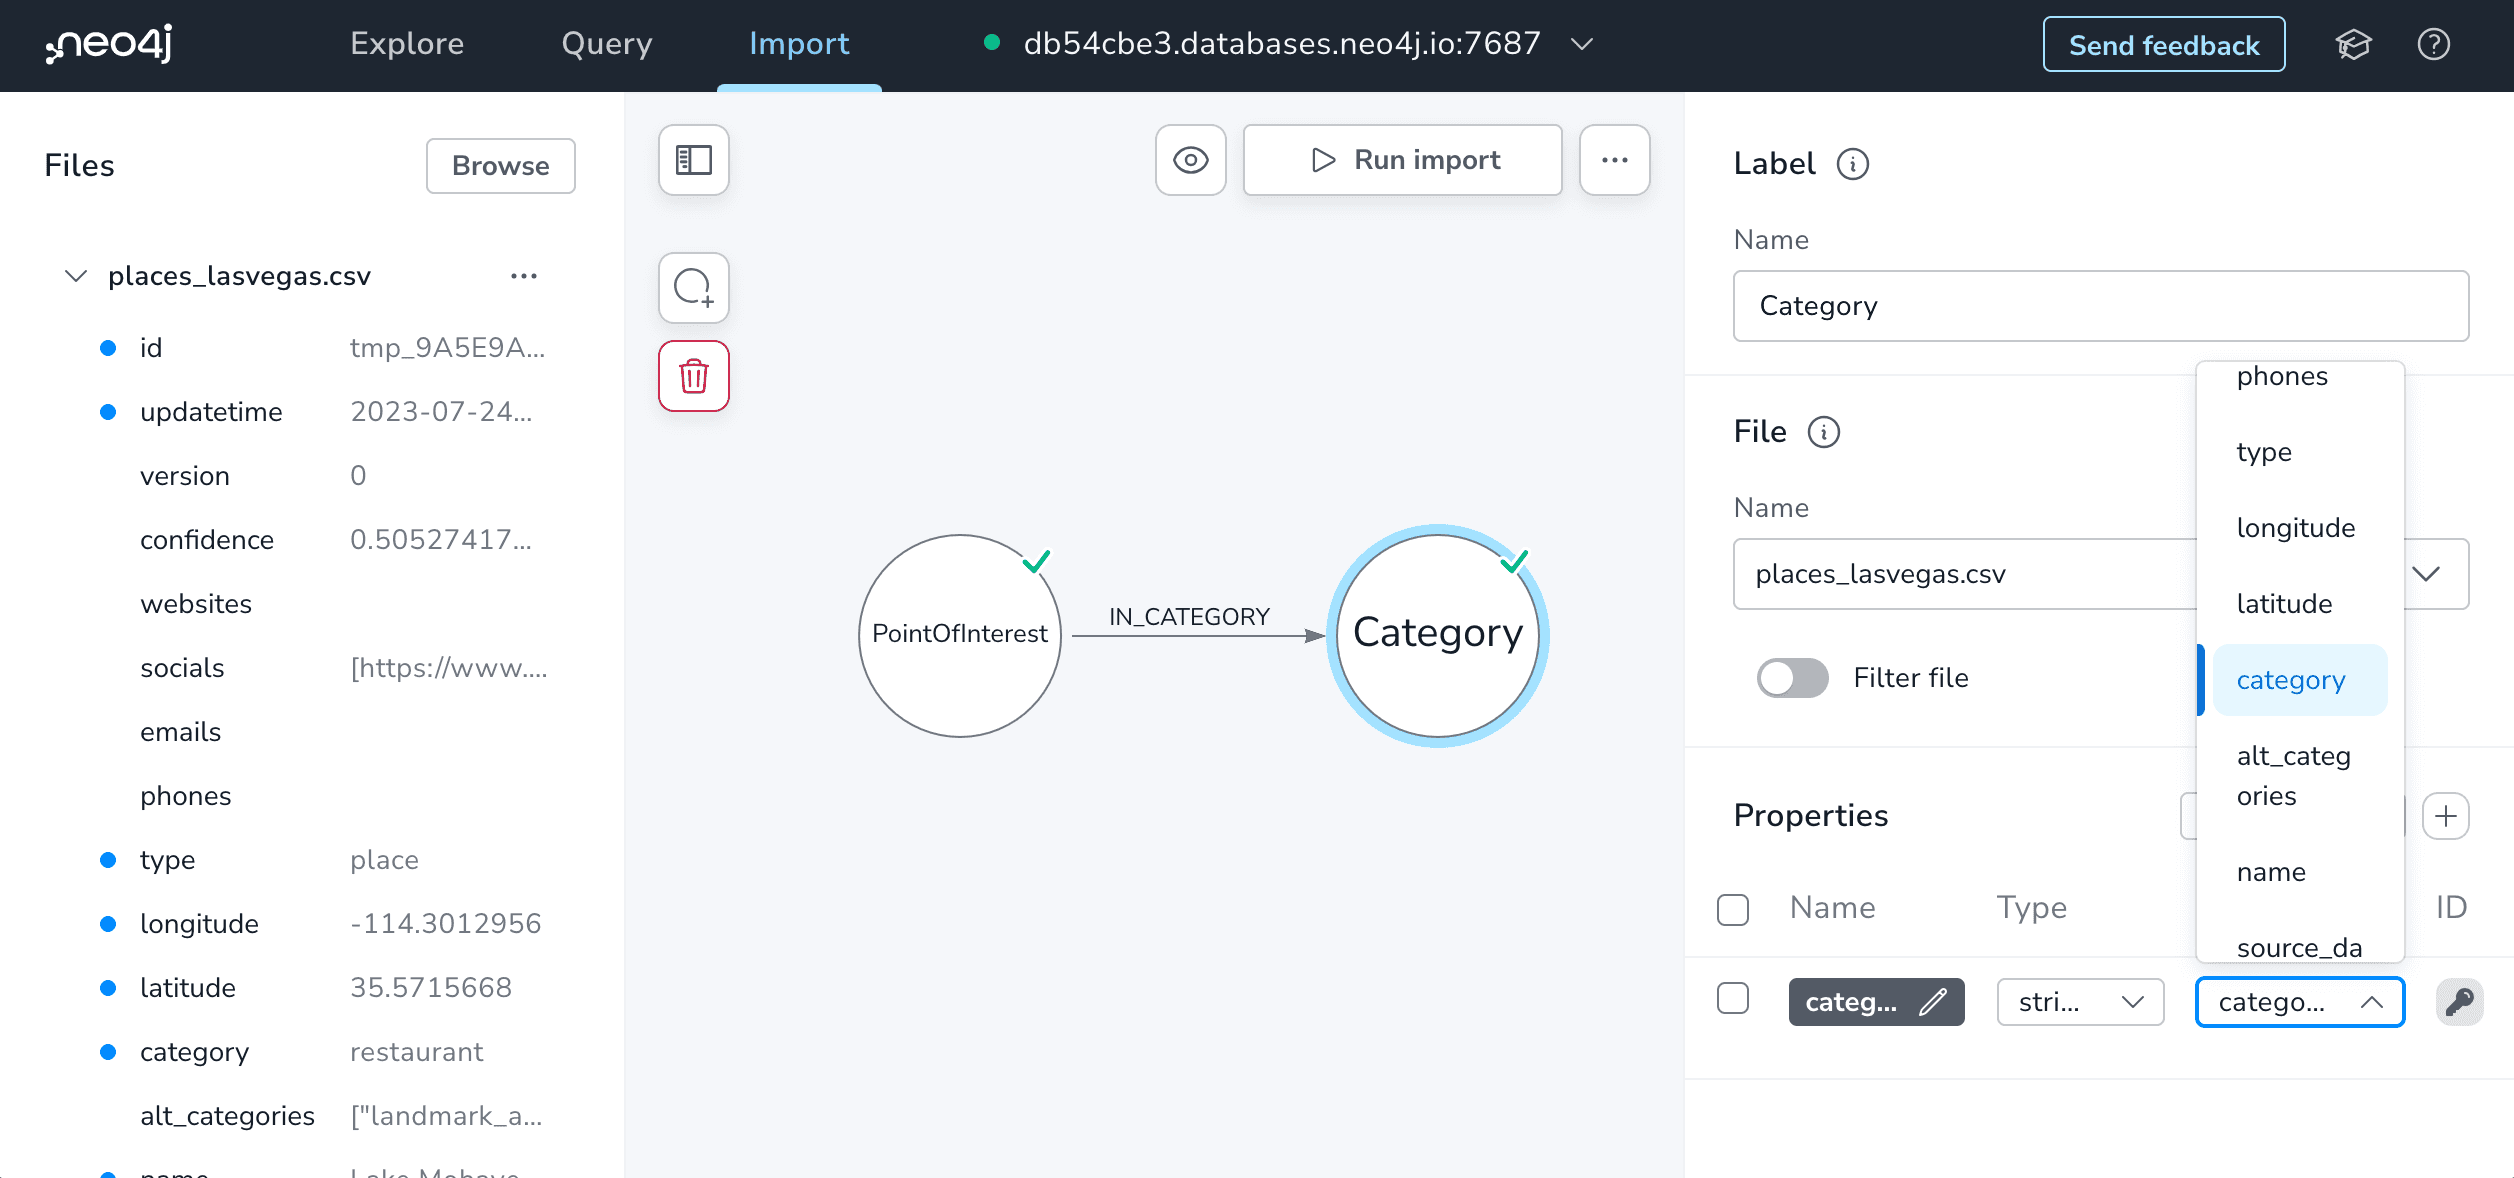
To enable the Neo4j Import tool to properly connect nodes we need to specify which fields hold the id values for the "from" and "to" nodes. In this case we have an id property for the PointOfInterest node which specifies the "from" node and the category property value specifies the "to" node.
Notice the green checkmarks that appear as we start to fill out more pieces of the property graph model indicating that we have specified the necessary field mappings.
Next, we continue building up our property graph model, mapping the entities to node labels and the fields that describe them to properties in the graph data model.
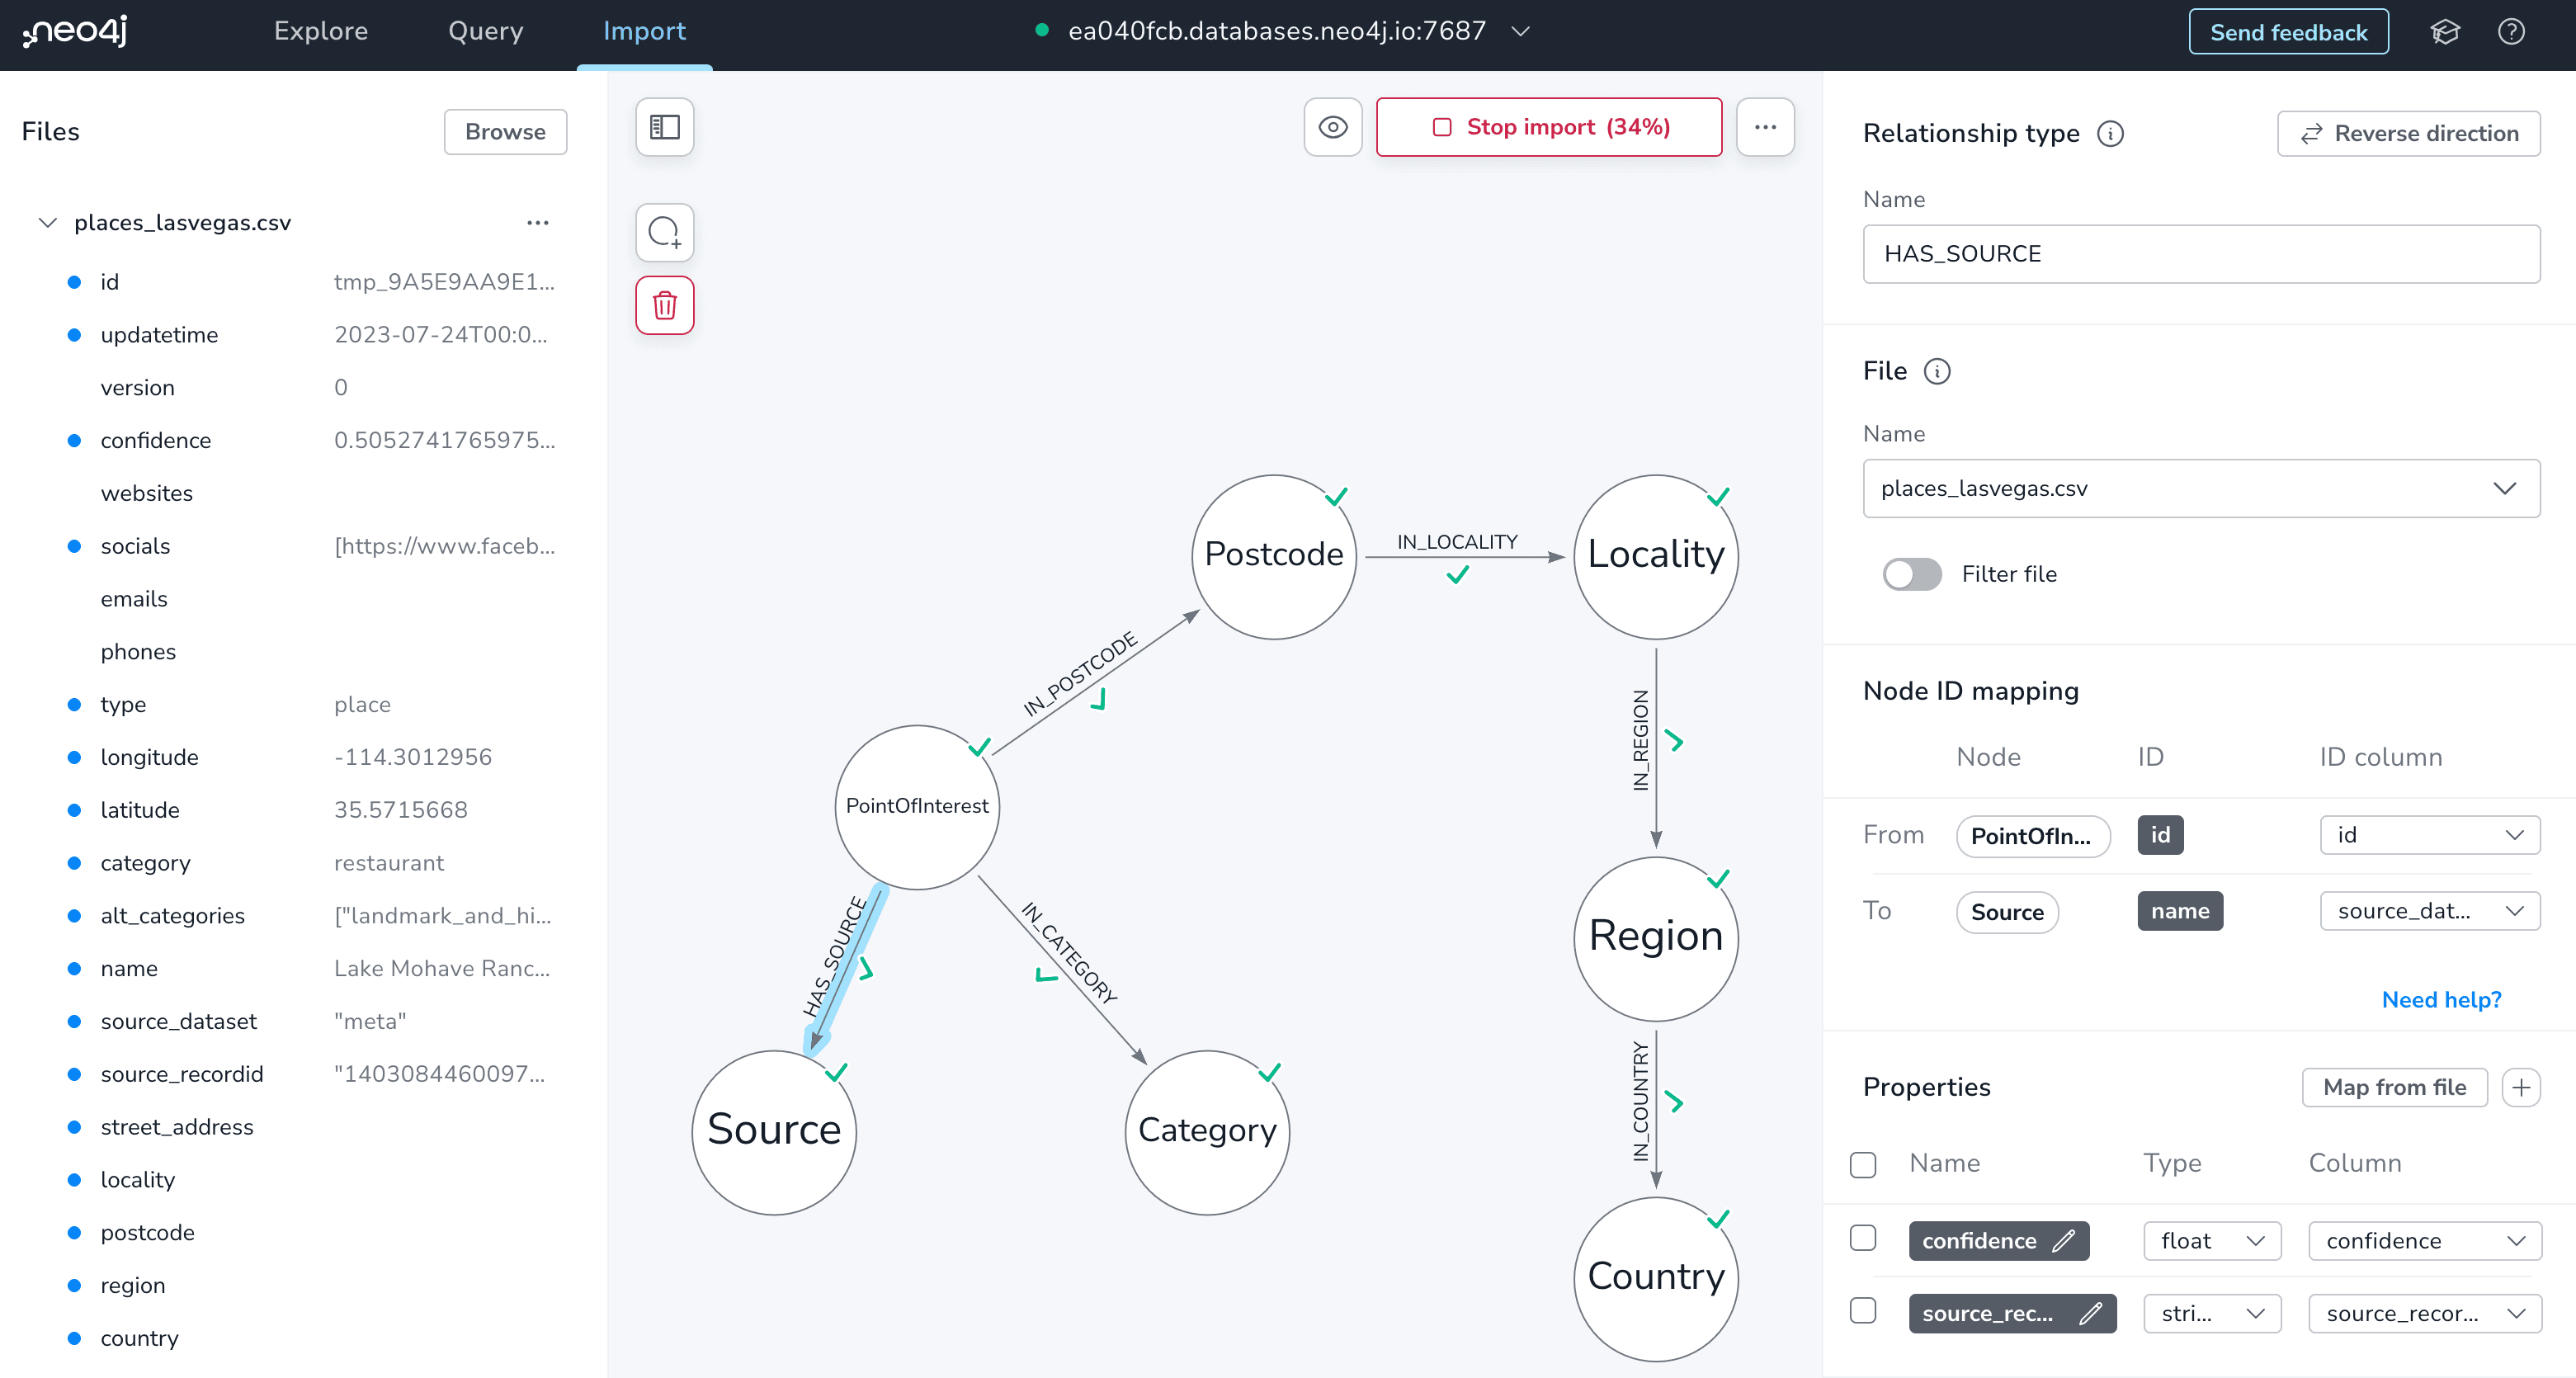
Here's the final graph model that I ended up with for the Overture dataset.
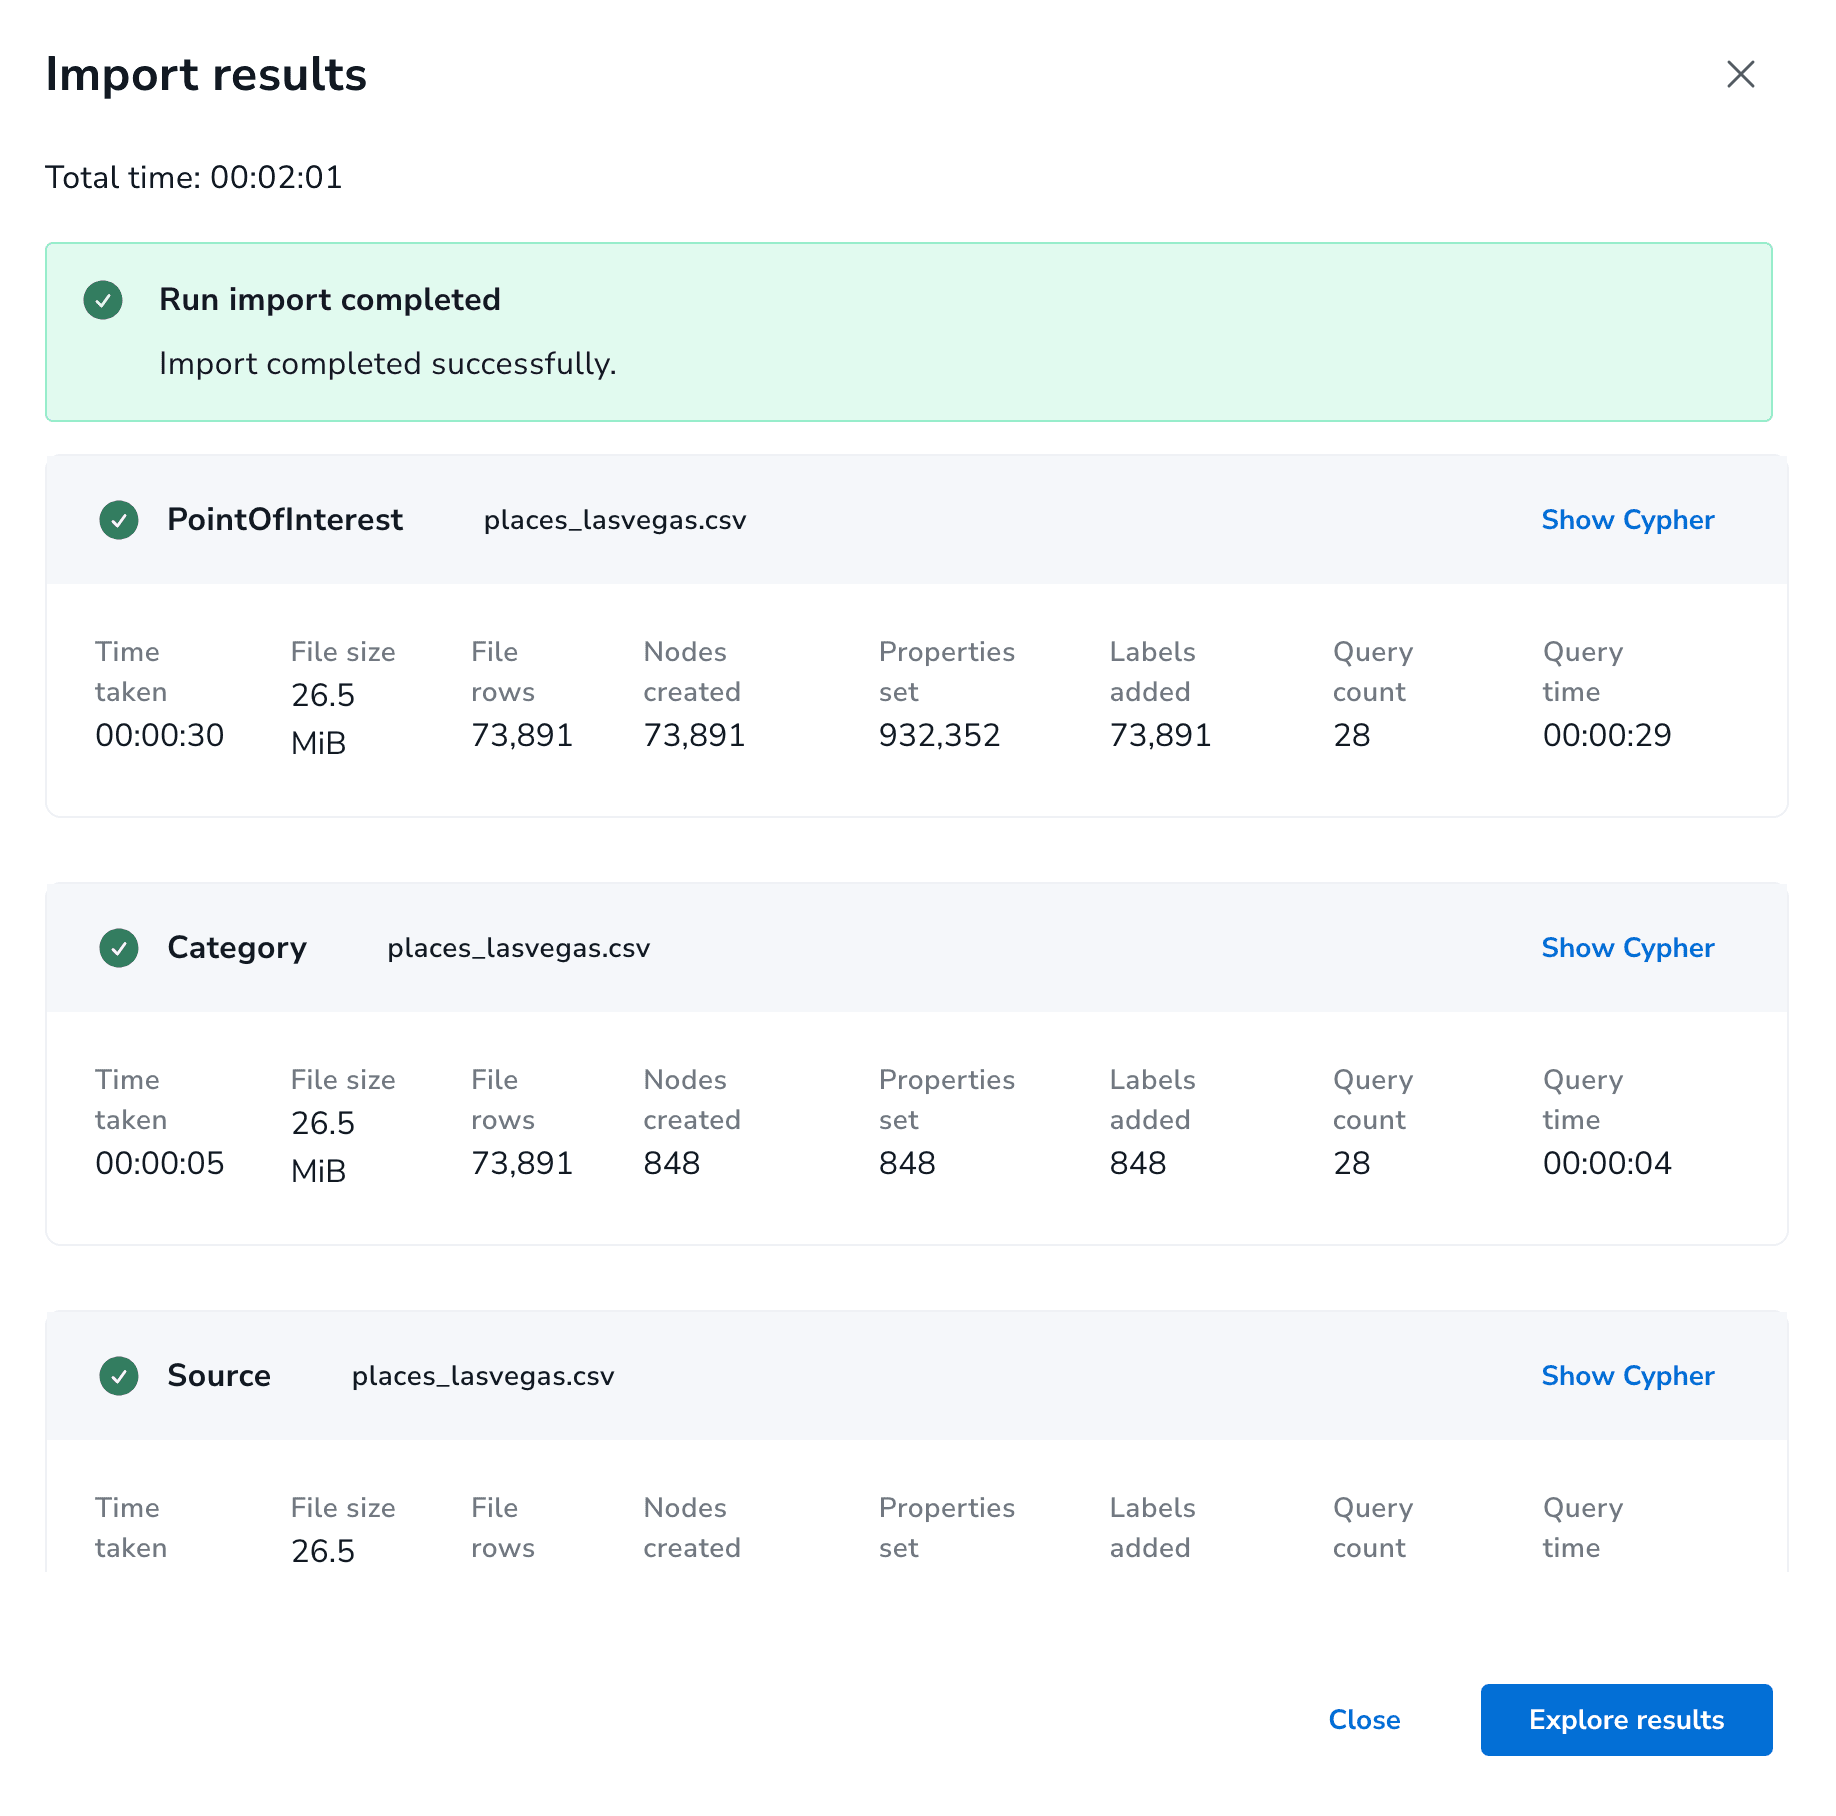
Once we've fully defined our graph data model and mapped to the associated fields of our CSV file we're ready to run the import into our Neo4j Aura instance.
To start the import process we'll click the "Run import" button. Behind the scenes the Neo4j Import tool will generate Cypher queries to create property constraints and then iterate over the data in our CSV file in batches to load data into our Neo4j Aura instance.
What Now?#
Now that we've loaded our geospatial data into Neo4j what can we do with it?
We can use the power of Cypher to query for points of interest near us, within certain categories for example. Or more complex queries for location-aware recommendations. For example, let's find all the wineries near me:
MATCH (p:PointOfInterest)-[:IN_CATEGORY]->(c:Category {name: "Winery"})
WHERE point.distance(p.location, {latitude: 37.594, longitude: -122.364}) < 100
RETURN p
But keeping with our theme of leveraging Neo4j's low-code tools what else do we have at our disposal? I've previously covered Neo4j Bloom which is a great tool for exploring graphs visually, so let's skip Bloom for now and take a look at two of Neo4j's other low-code tools: Neodash and the Neo4j GraphQL Toolbox.
Building Graph Dashboards With Neodash
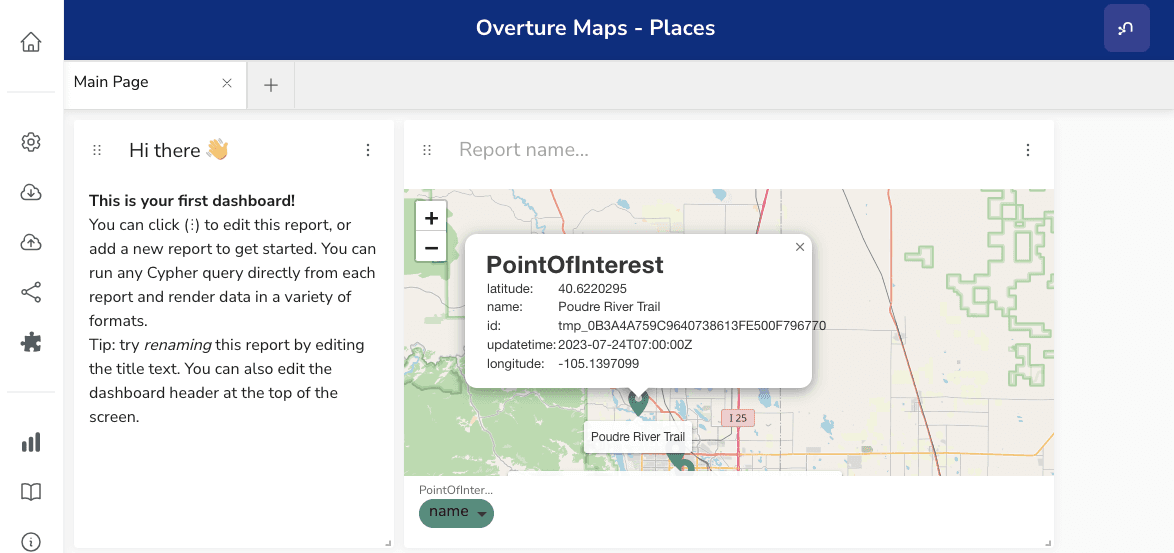
One of the easiest ways to work with data in Neo4j without writing code is to use NeoDash - a tool from the Neo4j Labs team for building standalone dashboards backed by Neo4j.
Neodash has support for creating maps and integrating spatial data into dashboards. Here we've just set up a very basic map view so we can explore the Overture data visually.
Put The Graph In GraphQL With The Neo4j GraphQL Toolbox
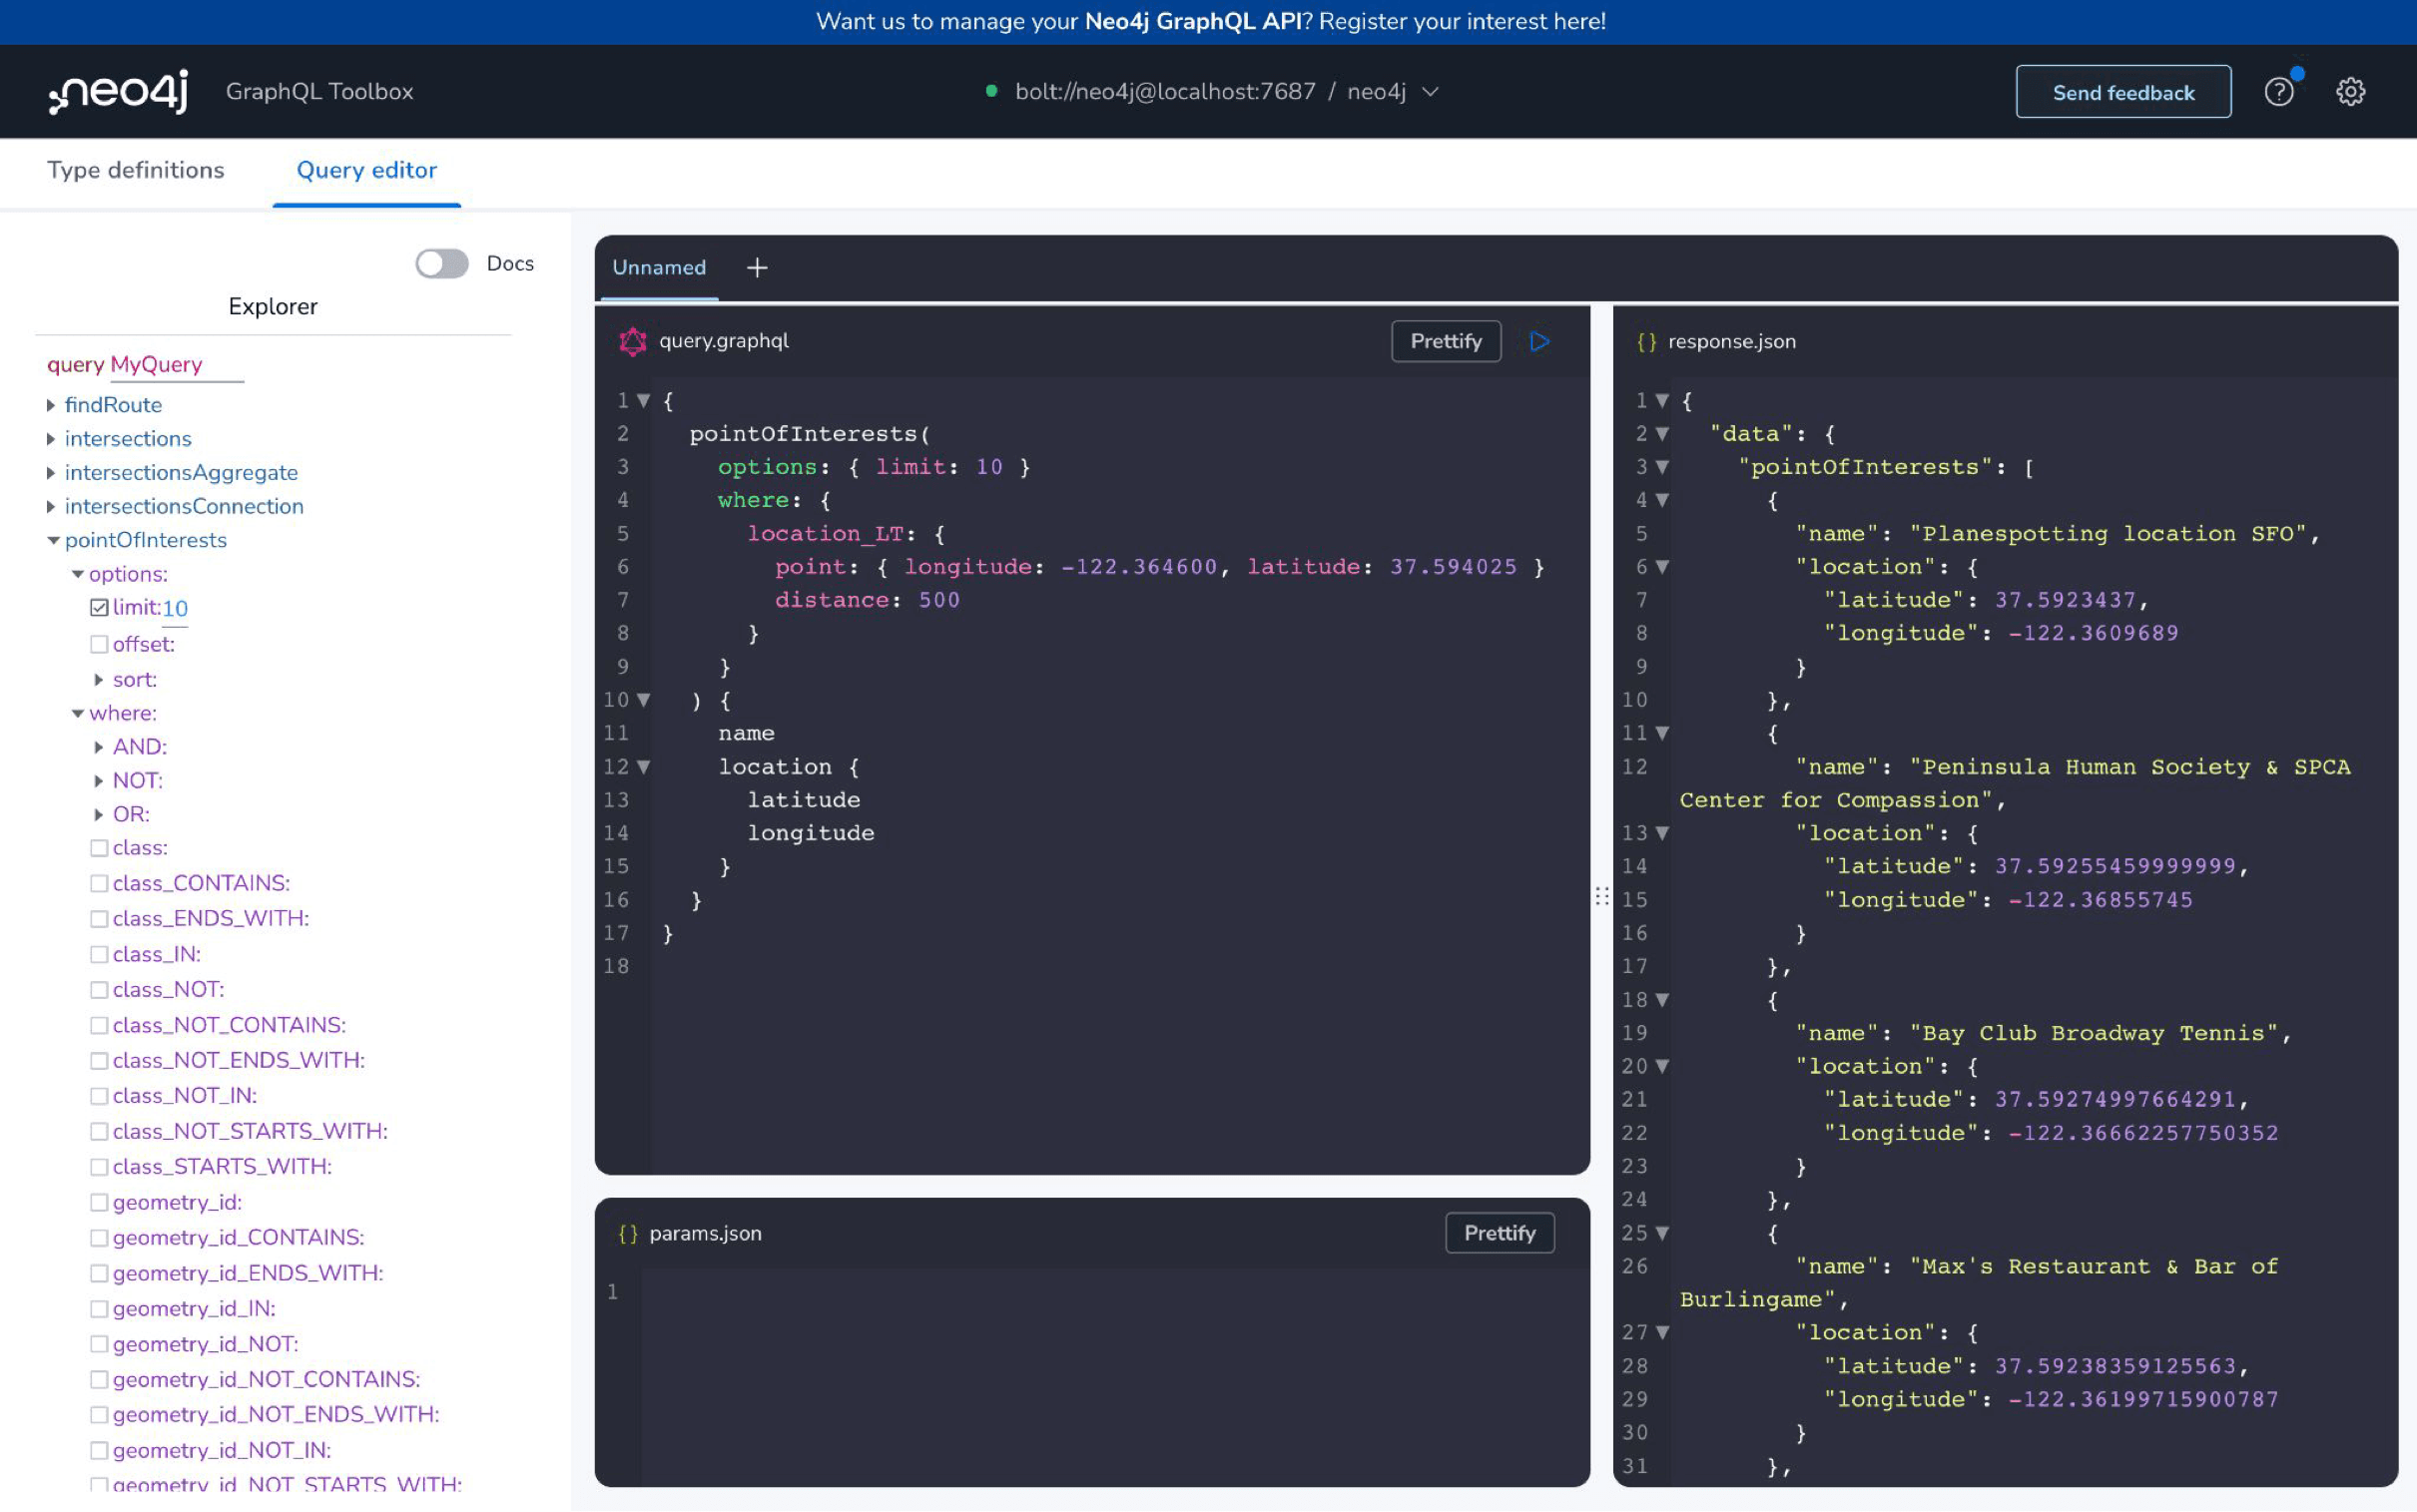
Another low-code tool from Neo4j is the Neo4j GraphQL Toolbox which allows you to create a GraphQL API backed by Neo4j without writing any code. We can just point the Toolbox at our Neo4j Aura instance and generate a fully functional GraphQL API.
This post is just a starting point for working with the Overture maps dataset in Neo4j. It's exciting to see what Overture is doing and I'll definitely be making use of their dataset for future projects.
Resources#
Stay Updated
Get notified about new posts and videos